The household saving rate
A deepening decline in real consumption is evident this year. This decline is due – in addition to weak nominal disposable income growth and elevated inflation – to tax changes and the trend in the saving rate. The latter has been rising recently (see Chart 1), probably because of consumer cautiousness stemming from considerable uncertainty on the labour market and expectations of further restrictive fiscal measures.
The CZSO publishes household saving rate statistics in the quarterly non-financial sector accounts for households, where the saving rate is defined as the ratio of gross savings to gross disposable income. The non-financial sector accounts for households are subject to revisions as part of the revisions of the national accounts. These revisions have been quite significant in the last two years from the saving rate perspective (see Chart 1). Considerable variability in the saving rate can be seen the period under review. The largest revision – 2.9 percentage points – was made for 2010 Q3. This means that the evolution of the saving rate should be interpreted with caution, taking account of the possibility of future data revisions.
Looking at an international comparison of saving rates (see Chart 2) we can see various reactions of households to the changes in national economies. Austrian households smoothed their consumption, so the saving rate decreased during 2009 and has only recently been gradually returning to its previous values. Polish households adjusted their saving rates much more flexibly in the period under review. Following a rise in 2009 H1, they pushed their saving rate down into negative territory. By contrast, the saving rate in Slovakia suggests a precautionary motive, as it exceeded 11% in 2010 and has remained at this level since then. In this light, the saving rate in the Czech Republic seems relatively stable over the entire period, as it is in Germany, although there it is more than 7% higher.
An alternative source of statistics – the household budget survey – can be used to analyse households’ saving rate behaviour. The aggregated quarterly household budget statistics published by the CZSO since the start of 2007 (see Chart 3) allow us to compare the saving rate, calculated as the difference between net money income and expenditure over net money income, with the statistics available from non-financial sector accounts (see Chart 1). 1 A comparison of the seasonally adjusted time series in the recent period reveals a similar saving rate trend for the two statistics, which is to a certain extent negatively correlated with the consumer confidence indicator. By contrast, a very different trend in the saving rate can be seen at the start of 2007, when the property market boom peaked.
A deeper analysis of annual household budgets available down to the level of individual households (see Chart 3) reveals that the growth in the saving rate compared to 2007 is due mainly to a marked decline in property purchases in the following years. In addition to falling expenditure on property purchases, however, the increase in the saving rate is due to falling long-term consumption. Falling purchases of motor vehicles have gradually acted in the same direction (although to a much lesser extent) since 2010. Based on this analysis, it is reasonable to assume that the saving rate growth observed in 2012 H1 was still due mainly to falling long-term household consumption.
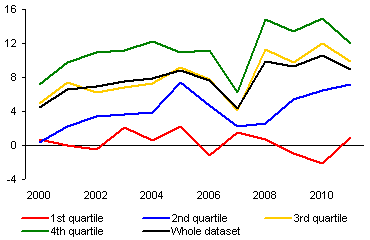
Looking at the saving rate by income quartiles (see Chart 4), one can see a slightly downward trend in the saving rate among households in the first income quartile. By contrast, higher-income households are showing a gradual increase in the long run. The position of the saving rate curve comprising all the monitored households indicates that high-income households are the main contributors to the overall saving rate. The upper quartile accounts for more than half of savings, and its share together with the third quartile is dominant.
Chart 1 (BOX) Revisions of saving rate
The revisions of the saving rate amount to almost 3 percentage points in individual quarters
(in % of gross disposable income; source: CZSO, seasonally adjusted)
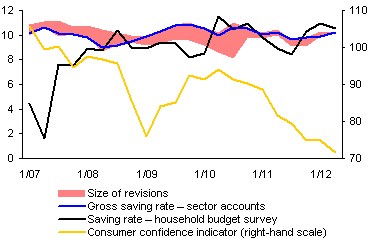
Chart 2 (BOX) International comparison of saving rate
The saving rate demonstrates different consumer behaviour in different countries during the cisis
(in % of gross disposable income; source: Eurostat, seasonally adjusted)
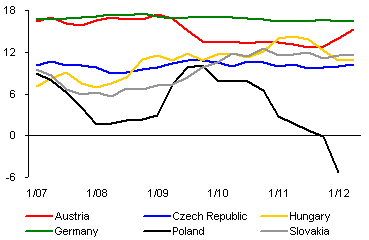
Chart 3 (BOX) Contributions to saving rate change against year 2007
The change in the saving rate against 2007 was positively affected by a decline in property purchases and by deferred long-term consumption
(contributions in percentage points; saving rate in % – right-hand scale; source: CZSO household budget survey)
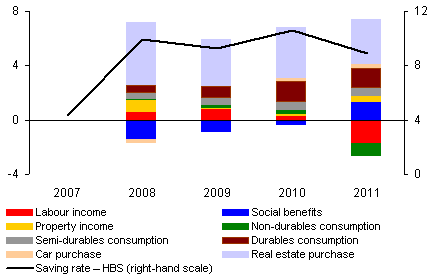
Chart 4 (BOX) Breakdown of saving rate by income quartile
With the exception of the first quartile, the saving rate is rising moderately
(in % of net income; source: CZSO household budget survey, CNB calculations)
1 For the purposes of analysing the saving rate calculated from the CZSO household budget survey, property acquisition was included in money expenditure in full, unlike in the national accounts, which consider property purchases as investment and include only imputed rents in consumption expenditure.