Households’ net wealth, income, savings and debt
(author: Renata Pašaličová)
The growth in household income is being reflected in an increase in consumption and indebtedness and is being accompanied by a decline in the gross saving rate. This rate has decreased since 2016, probably due to optimistic expectations arising from the labour market situation and low interest rates. This box analyses households’ net wealth and their income, savings and debt by income groups.
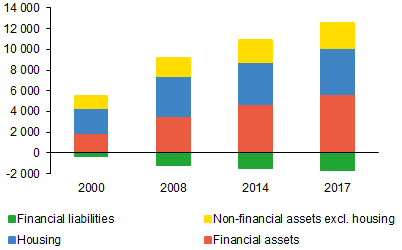
Households’ net wealth has increased due mainly to growth in financial assets. Investment in housing has also risen amid growth in property prices.1 Households’ balance sheet position is thus stronger overall than in the past (see Chart 1). Net wealth, which is important for smoothing consumption over time, has increased by 38% over the last ten years. Until 2016, this growth was accompanied by the gross saving rate fluctuating close to its long-term average (around 12%). Households’ financial and non-financial assets are still substantially higher than their financial liabilities (see Chart 2). Their net financial wealth rose at an even faster rate, by 71%, in the same period. The rise was driven mainly by growth in liquid deposits and currency and, to a lesser extent, by an increase in investment fund shares, insurance and pension reserves and purchases of long-term debt securities. A similar trend in households’ net financial wealth can be observed in the euro area. However, its ratio to annualised income is much higher there than in the Czech Republic (243%, as against a domestic ratio of 157%).2
Chart 1 (BOX) Net wealth of households
The net wealth of households has risen in recent years
(index; year 2000 = 100)
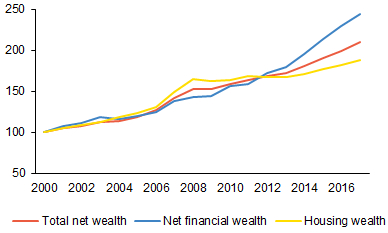
Chart 2 (BOX) Structure of households' net wealth
Households’ financial and non-financial assets significantly exceed their financial liabilities
(CZK billions)
Faster growth in consumption than in savings started to be reflected in a falling gross saving rate at the end of 2016. The household investment rate (9%) meanwhile increased further and was accompanied by growth in indebtedness. Growth in net financial wealth slowed, mainly due to lower growth in bank deposits. In terms of quarterly transactions, households were briefly in a net borrower position in 2017 Q3 for the first time since 1999. However, a survey conducted by the CZSO in 2018 reveals that households subsequently started to perceive an expected slowdown in economic growth, their motivation to save increased and the gross saving rate rebounded slightly (to 10%). Nonetheless, households’ optimism about their financial situation over the next 12 months remains at a historical high.
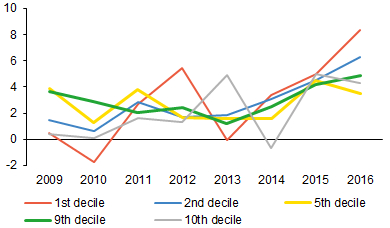
Households’ incomes have risen in all income groups (see Chart 3). According to the Statistics on Income and Living Conditions for 2017, incomes grew fastest in the first two income deciles and rather slower in the last three deciles3 in the previous year. In 2017, households viewed their financial situation as more favourable than in the previous period. The share of households that had no difficulty making ends meet rose to 42%. This improvement was observed for households in the first to seventh deciles, whereas the perceptions of households in the highest income deciles were essentially unchanged. Even so, one-third of households – and a full 65% of lowest-income households – could not afford to pay unexpected expenses.
Chart 3 (BOX) Net money income of selected household income groups
Household incomes have risen across all income deciles
(annual percentage changes; in nominal terms)
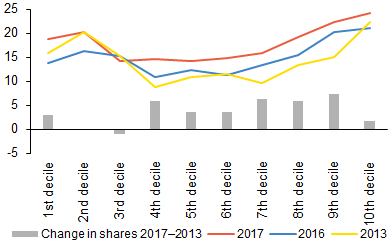
The share of households with mortgages has increased in the medium- and high-income categories (see Chart 4). While the share of households with mortgages grew fastest in the highest income decile in the past, this share also rose for most medium- and low-income households between 2013 and 2017.4 The share of households with mortgages rose to 18% overall in 2017. In the highest income decile it reached 24%. By contrast, the share of households using consumer credit fell to around 9%. A decline was observed across all income groups. The ratio of total debt to annual income is highest for low-income households (about 50%), while for medium- and high-income households it is around 35% and 46% respectively.
Chart 4 (BOX) Shares of households with mortgages by income groups
The shares of households with mortgages has increased in most income groups
(shares in %; change in shares in percentage points)
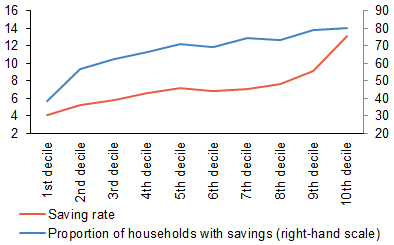
The saving rate increases with increasing income (see Chart 5). The highest saving rates in 2017 were recorded in the ninth and the tenth income deciles. In the other income deciles they were much lower and below the overall rate. The saving rates in the highest income decile and some lower-income groups started to decline in 2016 due to consumption growing faster than income. Compared with the pre-crisis period, however, the consumption-to-income ratio was down in all income groups. Households thus had a rather larger proportion of their income left even after covering loan repayments.
Chart 5 (BOX) Saving rates of individual household income groups
The saving rates in the two highest income deciles are much higher than those in the other household income groups
(percentages; 2017)
The shape of the Lorenz curve indicates persisting inequality in the creation of money savings (see Chart 6). Households with above-median incomes accounted for around 76% of total savings in 2017. The Gini coefficient, measuring the rate of relative inequality, was 0.41 for savings.5 The inequality in the distribution of income has decreased slightly. Households with above-median incomes account for 67% of incomes. This is consistent with the Gini coefficient, which has fallen to 0.25.
Chart 6 (BOX) Lorenz curve
The inequality in the distribution of money savings was higher than the inequality in income and loans
(percentages on both axes; 2017)
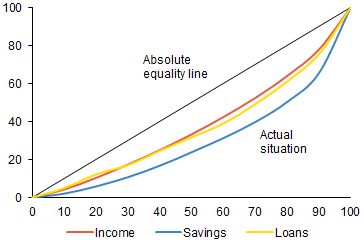
Note: The x-axis is the percentage cumulative share of households by income and the y-axis is the percentage cumulative share of households in income, savings and loans.
To sum up, households’ balance sheet position is stronger than it was in the past, but differences persist among income groups. Financial assets have grown at a higher rate than liabilities. The proportion of households with mortgages has risen in most income groups. The distribution of money savings remains very unequal.
1 However, the Czech data do not indicate that the rising property prices are affecting households’ consumption and saving decisions, as property owners tend to have a higher saving rate and a lower propensity to consume than households living in rented properties, independently of whether property prices are moving up or down (J. Brůha, M. Hlaváček and L. Komárek (2017): House Prices and Household Consumption: The Case of the Czech Republic, CNB Working Paper 11/2017).
2 According to Eurostat, the net financial wealth to income ratio of households in the Czech Republic is one of the highest in the Central European region (Slovakia, Poland and Hungary have ratios of 68%, 107% and 179% respectively).
3 Households are divided into income deciles according to annual income per person.
4 The relatively high share of households with mortgages in low-income groups is due to the division of households into income deciles by annual income per person, where the number of household members plays an important role.
5 The Gini coefficient ranges from 0 to 1, with a higher value indicating higher inequality and a lower value lower inequality.