A model of the effective indicator of industrial producer prices in the euro area
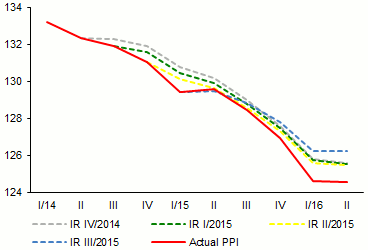
The CF forecast of the effective indicator of industrial producer prices in the euro area (PPI) is generally less reliable1 than, for example, the outlooks for effective inflation or GDP in the euro area. Moreover, the quality of the PPI forecast has deteriorated significantly in recent years. The PPI recorded a constant deep decline in this period, owing initially to the previous economic downturn in the euro area and later to the drop in world prices of oil. By contrast, the CF and EIU forecasts for individual countries mostly returned relatively rapidly to the long-run equilibrium rate of inflation. They therefore significantly overestimated the subsequent outcomes without sufficiently quickly and strongly taking into account the downturn in economic activity and subsequently the drop in prices of oil and other commodities, which account for a large proportion of costs in industry. For the purposes of the CNB forecast, therefore, the PPI scenario has been lowered (since 2015 Q4) to varying degrees relative to CF and the EIU. These past expert adjustments shifted the forecast in the right direction (see Chart 1), but to an insufficient extent from the current perspective. This box presents a simple econometric model that provides a PPI forecast consistent with the expected evolution of other variables in the external environment. It can therefore be used as a systematic tool to verify the consistency of the outlooks for foreign variables and potentially as a guide for making expert adjustments to the PPI outlook in terms of both their direction and magnitude.
Chart 1 (BOX) Comparison of expert adjustments with baseline PPI scenarios based on CF and EIU forecasts
Past expert adjustments shifted the PPI forecast in the right direction, but to an insufficient extent from the current perspective
(base index; year 2000 = 100; source: CF, EIU, CNB calculation)
Note: The unbroken lines depict the expert adjustments of the PPI scenarios for the given forecasts. The dashed lines denote the scenarios based on CF and EIU forecasts.
The model specification is based on the assumption that the PPI is strongly affected by commodity prices, among which the price of Brent crude oil plays a key role.2 Furthermore, it can be assumed that producer prices reflect the exchange rate of the euro, which affects producers’ import costs and export competitiveness. In this case, the exchange rate of the euro against the US dollar is incorporated (EUR; an increase means appreciation of the euro). Finally, producer price inflation can be expected to be higher at a time of high real euro area growth (GDP) than at a time of recession. To capture the long-term equilibrium relationship between the time series and the short-term dynamics simultaneously, the following error correction model (ECM)3 is used:
Δlog(PPIt) = 0.60 · Δlog(PPIt-1) + 0.03 · Δlog(Brentt)
+ 0.22 · Δlog(GDPt) – 0.07 · [log(PPIt-1) – 1.24 – 0.06 · log(Brentt-1)
– 0.15 · log(EURt-1) – 0.70 · log(GDPt-1)]
The short-term PPI dynamics are affected in a statistically significant manner by euro prices of oil and euro area real GDP growth. By contrast, the effect of the euro exchange rate is not significant from the short-term point of view. There is also a long-run equilibrium relationship between these economic variables, although the return to this equilibrium is only gradual. According to this relationship, higher euro prices of oil and economic activity are connected with a higher PPI, in line with intuition. Conversely, the relationship between the euro exchange rate and producer prices in this equilibrium relationship is rather surprising, as, in the long run, producer prices display a statistically significant rise, not a fall, as the euro appreciates.4
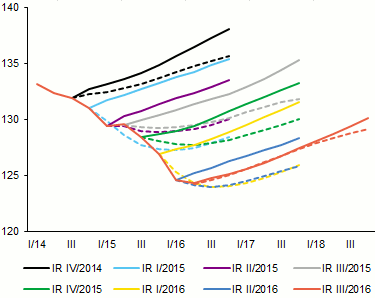
In addition to test statistics, the quality of the estimated model can be shown by simulations using data known ex post (see Chart 2). It can be seen that if actual (subsequently realised) values of the explanatory variables are used to simulate the PPI forecast, the consistency of the forecast with the subsequent PPI outturns at the given horizon is very satisfactory.
Chart 2 (BOX) Simulation of model forecasts with knowledge of the evolution of independent variables
If the model had had knowledge of the explanatory variables, it would have simulated the subsequent path of the PPI very well
(base index; year 2000 = 100; source: CF, EIU, CNB calculation)
Note: The unbroken line depicts the actual path of the PPI. The dashed lines denote the model forecasts from the given period using the ex post realised evolution of the explanatory variables.
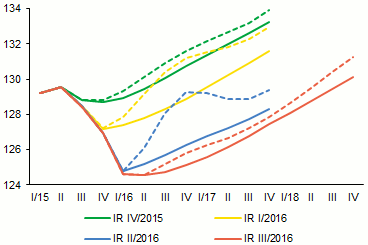
In practice, however, the model will have to be based on imperfect forecasts of the explanatory variables. Simulations of the PPI forecasts in real time5 (see Chart 3) capture subsequent outturns in recent years better than the scenarios based on CF and EIU forecasts, even though in the most recent forecasts these scenarios were expertly adjusted in the right direction (i.e. lowered, see above). The model will thus be used to ensure that the expert adjustments made to the effective euro area PPI are consistent with the outlooks for other foreign variables. That said, the CF and EIU outlooks have recently converged with the results of the model for the first time in a long time. For this reason, the need for expert adjustment was only small this time.
Chart 3 (BOX) Simulations of the model forecasts in real time and comparison with the assumptions of the relevant forecasts
The PPI model provides better forecasts than the scenarios based on CF and EIU forecasts
(base index; year 2000 = 100; source: CF, EIU, CNB calculation)
Note: The unbroken lines depict the known outturns and the related PPI scenarios from the relevant forecasts. The dashed lines denote the model forecasts using the actual scenarios for the explanatory variables from the given forecasts.
1 Prices of other industrial commodities and agricultural commodities are highly correlated with the price of oil. The price of oil in euros is important for European producers (and hence also for the model).
2 The model is estimated using the least squares method on quarterly time series. The data start in 1993 Q1 and end in 2016 Q1. Time series that are assumed to behave exponentially in the long run are log-linearised. The coefficients for variables in differences (for which the Δ operator is used) are interpreted from the economic perspective as short-term elasticities. To remove auto-correlation in residuals, the equation includes a lagged value Δlog(PPIt-1). Only statistically significant variables are included in the equation.
3 Rather than a causal relationship between the exchange rate and prices, this may be just co-movement due to a common factor such as non-price competitiveness which is not explicitly captured by the model. It may lead concurrently to appreciation/depreciation of the nominal exchange rate of the euro and to higher/lower euro area producer prices. This property of the model will be subject to further analysis.
4 Consensus Forecasts publications pay little attention to the PPI – Germany and Italy are the only euro area countries for which such forecasts are published. Moreover, the forecasts are calculated on the basis of projections from about only one-half of the number of analytical institutions compared, for example, to the inflation or GDP forecasts. The EIU forecasts for other euro area countries are therefore also taken into account in the calculation of the effective PPI indicator.
5 This means the model is estimated, as in the first case, only using known data up to the forecast date. Scenarios of the explanatory variables from the relevant forecasts are used for subsequent forecasts.