MONETARY POLICY REPORT | SUMMER 2026 (box 1)
(authors: Vojtěch Molnár, Jan Schmidtmayer, Radek Šnobl)
The Czech economy is experiencing buoyant growth in nominal wages. Wage growth was 6.6% in both 2024 and 2025 and rose to 8.1% in 2026 Q1. These figures are well above the long-term equilibrium wage growth rate of 4.5% that is consistent with the fulfilment of the inflation target. This box analyses wage growth from the long-term perspective. It examines developments in individual sectors of the economy and places the current position of the Czech economy in the historical context in terms of the convergence process, labour costs and productivity.
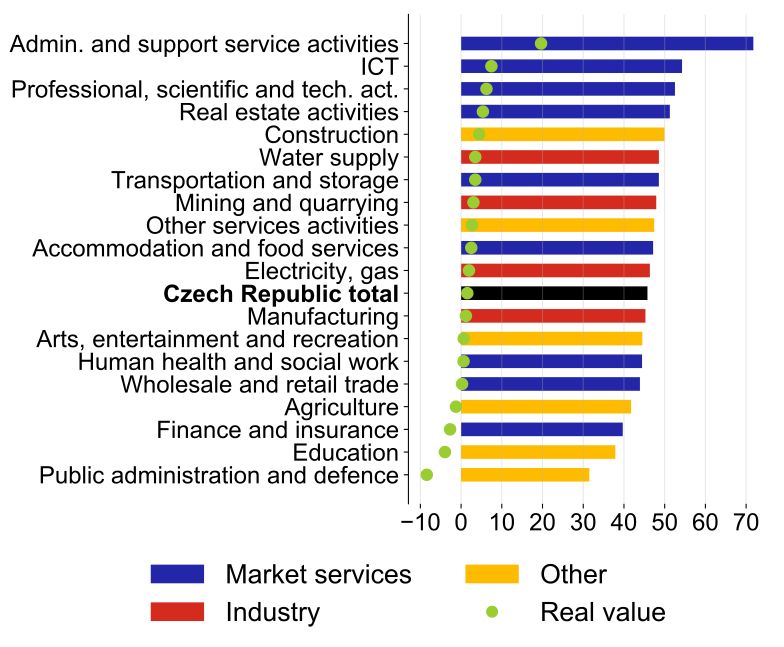
Between 2019 Q4 (the last pre-pandemic quarter) and 2026 Q1, the seasonally adjusted average nominal wage in the Czech Republic grew by around 45% (nominal GDP rose by 46% over the same period). However, real wages went up by only 1.5% in the same period and did not exceed their pre-pandemic level until the start of this year (see Chart 1). The highest wage growth was recorded in some market services, but others saw weaker growth. In market services as a whole, therefore, wages increased only slightly faster than in industry. The average wage in manufacturing, the largest sector of the economy, rose at roughly the same pace as the overall average wage. By contrast, the non-market sector lagged somewhat behind the rest of the economy, especially in public administration and defence and in education. In most NACE sections, the cumulative wage growth lies within a relatively narrow range of 40–50%, and, with only a few exceptions, does not differ significantly across sectors.[1]
Chart 1 – Since 2019, wages have increased the most in some market services, but industry has not lagged far behind and wage growth has been similar across most sectors
cumulative wage growth in % in NACE sections, 2019 Q4–2026 Q1; seasonally adjusted; source: CZSO
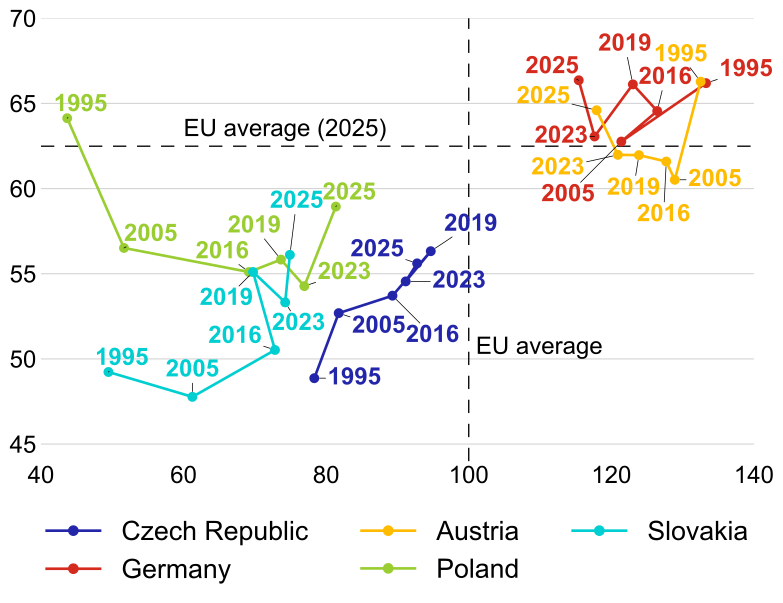
Viewed from an even longer-term perspective, the wage growth in the Czech economy has taken place amid gradual catch-up with more advanced economies. Chart 2 compares the Czech Republic with its neighbours in terms of economic level relative to the EU average and the share of labour compensation in value added.[2] Between 1995 and 2019, the Czech Republic’s position moved mostly upwards and to the right; its relative economic level increased from about 78% to 95% of the EU average, while the share of wages in gross value added rose from just under 49% to 56%. This shift reflected the long-term process of catch-up with more advanced economies and, towards the end of the pre-pandemic period, also a tight labour market. The pandemic and the subsequent inflation shock interrupted this convergence path. After 2019, the Czech Republic’s relative economic level declined and the wage share fell to around 54% in 2023. A return to convergence was apparent in 2024 and 2025.
Chart 2 – The Czech economy had long been converging towards the EU average in both economic level and wage share, but it is returning only gradually to a convergence path following the pandemic
x-axis: GDP per capita in purchasing power parity relative to EU average; y-axis: share of compensation of employees (converted into total employment) in gross value added; %; source: Eurostat, CNB calculation
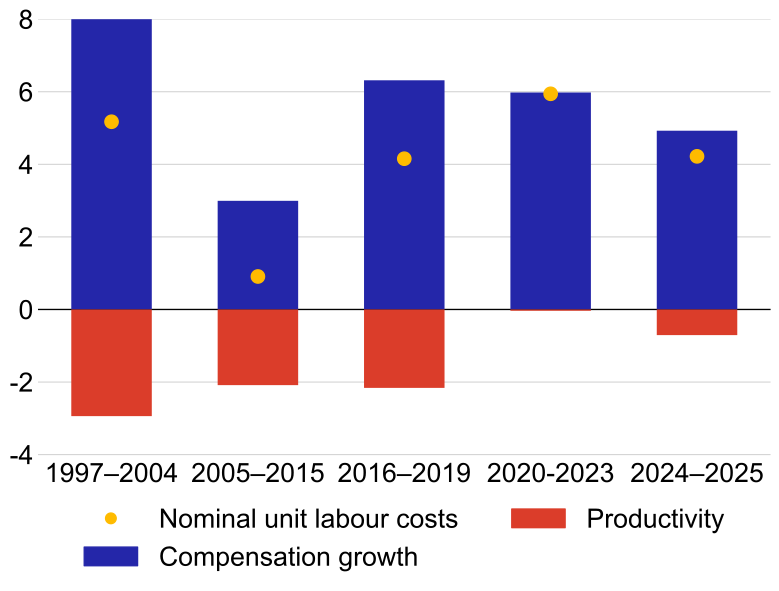
In terms of nominal labour costs and labour productivity, the Czech economy has gone through several distinct phases since the mid-1990s.[3] Between 1997 and 2004, rapid growth in compensation of employees was partly offset by strong labour productivity growth. Even so, growth in hourly unit labour costs exceeded 5% (see Chart 3). From the perspective of cost competitiveness, the period from 2005 to 2015 was characterised by a favourable combination of moderate wage growth and continued productivity growth, resulting in only very modest growth in unit labour costs. Only after 2015 did a major change occur, in connection with a tight labour market and labour shortages. Growth in compensation of employees surged, while productivity growth was no longer able to offset the wage pressures to the same extent as before. This became apparent in 2020–2023, when growth in hourly unit labour costs reached its highest levels in the period under review, while hourly labour productivity was flat. The cost pressures eased somewhat in 2024–2025, due to both slower growth in compensation of employees and renewed growth in labour productivity. However, productivity growth offset the increase in labour costs to a lesser extent than it did in the pre-pandemic period.
Chart 3 – The slowdown in labour cost growth in recent years has been accompanied by a modest recovery in productivity growth
decomposition of average growth in hourly unit labour costs; % and pp; source: Eurostat, CNB calculation
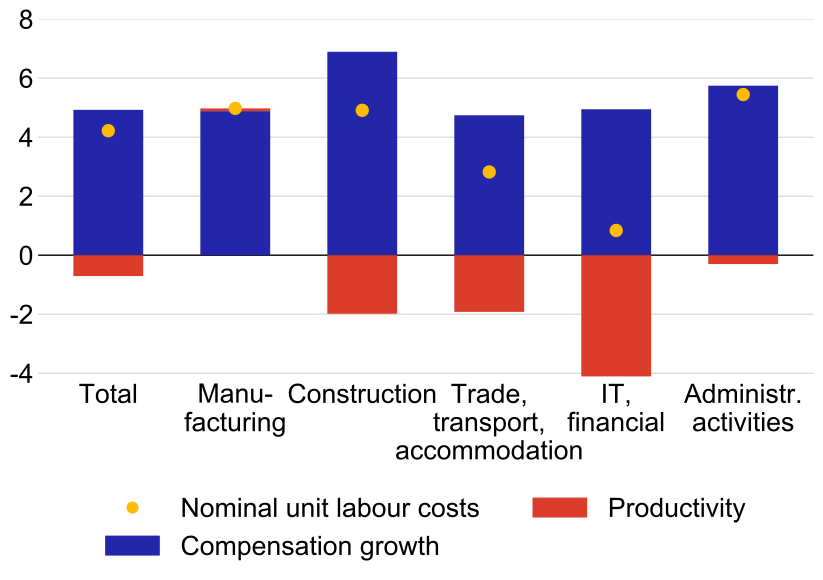
The sectoral breakdown for 2024–2025 (see Chart 4) also points to heterogeneity of the Czech economy. In manufacturing, there are no signs yet of productivity recovering sufficiently to offset the ongoing wage growth. A similar pattern can be seen in parts of both market and non-market services, reflecting their more limited ability to offset growing compensation by raising productivity. By contrast, productivity has increased in recent years in information and communication technology, trade and transport. Following a previous sharp decline, it has also increased in construction.
Chart 4 – Productivity growth recovered only in part of the economy in 2024–2025
decomposition of average growth in hourly unit labour costs in 2024–2025; % and pp; source: Eurostat, CNB calculation
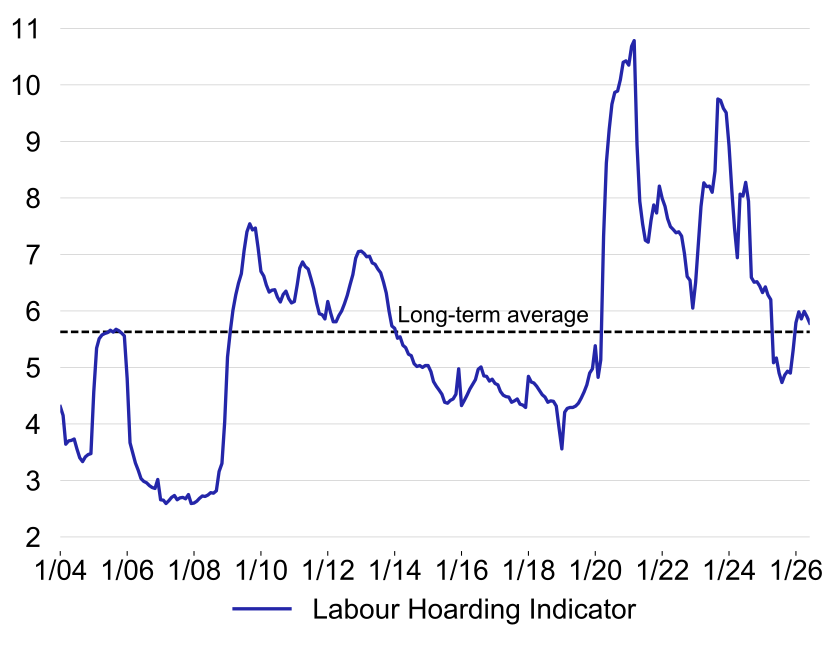
The above discussion of productivity trends in recent years is complemented by the Labour Hoarding Indicator (LHI; see Chart 5), which captures the share of firms expecting output to decrease while at the same time expecting employment to increase or remain unchanged.[4] The LHI reached historical highs for the Czech economy following the outbreak of the COVID-19 pandemic, started to decline at the end of 2024 and is currently close to its long-term average. This suggests that during the period of heightened uncertainty associated with the pandemic lockdowns and the surge in inflation, many firms – probably partly because of their previous difficulties in recruiting suitable staff when the labour market was very tight – preferred to retain employees despite having no immediate need to utilise them fully. This is naturally associated with temporarily lower productivity. By contrast, the lower LHI values in recent quarters are consistent with the partial recovery in productivity observed already, which the forecast expects to continue over the forecast horizon.
Chart 5 – Following a period of record highs, the Labour Hoarding Indicator declined last year to close to its long-term average
%; weighted share of firms; 12-month moving average; seasonally adjusted; source: European Commission
The historical perspective shows that over past decades the Czech economy gradually converged towards more advanced European economies not only through a rising economic level, but also through an increasing wage share in value added. The pandemic and the subsequent inflation shock interrupted this process, leading to a sharp drop in real wages and weakening the link between nominal wage growth and hourly labour productivity. In 2024–2025, productivity growth recovered and the cost pressures eased, but this process has so far been only gradual and uneven across sectors. The current combination of recovering economic activity, inflation close to the target and gradually rising productivity, despite still relatively strong nominal wage growth, suggests that the wage cost pressures in the Czech economy are steadily weakening, though not abruptly.
[1] In administrative and support service activities, which recorded markedly stronger wage growth than the rest of the economy, temporary work agencies play an important role. As a result, this sector encompasses a diverse range of employees in terms of actual work activity.
[2] The analysis uses an adjusted series for compensation of employees that also considers the work performed by entrepreneurs and the self-employed. It is constructed by adding an estimated labour income component for self-employed persons to compensation of employees by converting the average compensation of employees into total employment. The resulting indicator is then expressed as a share of gross value added, which better reflects the value generated by production itself. Unlike GDP, gross value added is not augmented by net taxes on products, whose differing levels could distort international comparisons of the wage share.
[3] For the purposes of this box (see Charts 2, 3 and 4), the period under review is divided into the following sub-periods: up to 2004 (the Czech Republic’s accession to the EU); 2005–2015 (economic expansion interrupted by the global financial crisis and a marked slowdown in wage growth); 2016–2019 (strong wage growth and pronounced labour market tightness amid buoyant economic growth); 2020–2023 (the COVID-19 pandemic and the period of high inflation) and 2024–2025 (the resumption of solid economic growth alongside the return of inflation to the target).
[4] The Labour Hoarding Indicator shows the weighted share of firms which, according to the European Commission’s Business and Consumer Survey, expect their output to decrease over the next three months while expecting employment to increase or remain unchanged. As the indicator is based on a qualitative survey, it has certain limitations and exhibits relatively high volatility, so short-term fluctuations should be interpreted with caution. Its longer-term trend can nonetheless provide a useful complementary perspective on labour utilisation in the economy.