MONETARY POLICY REPORT | SUMMER 2026 (box 3)
(author: Eva Hromádková)
The recent rapid growth in consumer credit provided by banks raises the question of whether it reflects the usual relationship with consumption, or whether it is linked with the mortgage market recovery. In other words, households may be making greater use of some non-specific consumer loans to finance their housing-related needs or to cover other expenses associated with housing purchases. Granular data from the UVIS[1] survey do not indicate an increase in the simultaneous arrangement of consumer and mortgage loans for the same client at a single bank. However, this does not preclude the possibility of another member of the household taking out a consumer loan and using it flexibly to finance housing needs. In this box, this evidence is supplemented by an analysis of relationships at the aggregate level.
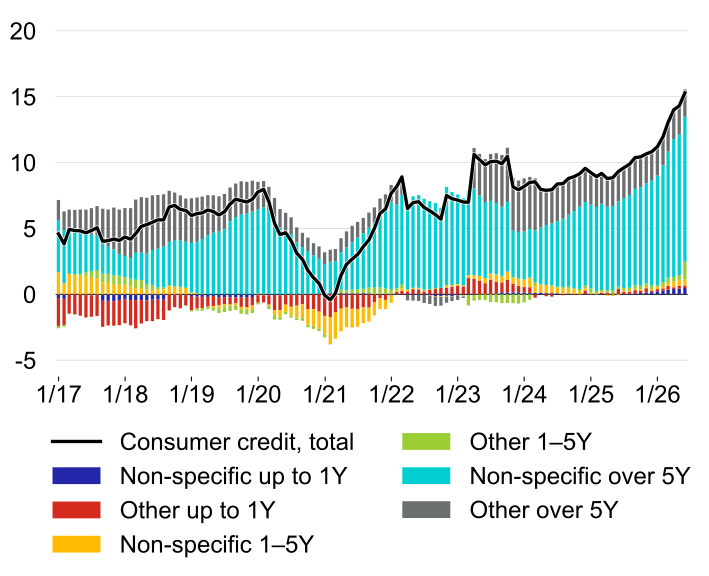
After stagnating in 2020–2021, the share of consumer credit in the loan portfolio has been increasing again since 2022. The total volume of consumer credit reached CZK 428 billion at the end of 2026 Q2, accounting for 15.8% of total bank loans to households. Around 85% of consumer loans have a maturity of more than five years, and roughly three-quarters of this category are non-specific loans. It is this segment that has recorded the strongest growth over the past year (see Chart 1). Quarterly genuinely new lending has risen from an average of CZK 22.6 billion in 2020–2023 to CZK 36.8 billion since 2024, reaching CZK 49.8 billion in 2026 Q2. Its ratio to final household consumption has meanwhile gone up from a long-term average of around 3% to 4.3%, so lending has been growing faster than consumption itself. This may indicate more intensive use of credit to finance consumption expenditure, but it may also point to a shift towards borrowing for other purposes.
Chart 1 – Growth in consumer credit is currently being driven primarily by long-term non-specific loans
y-o-y changes in %; contributions in pp
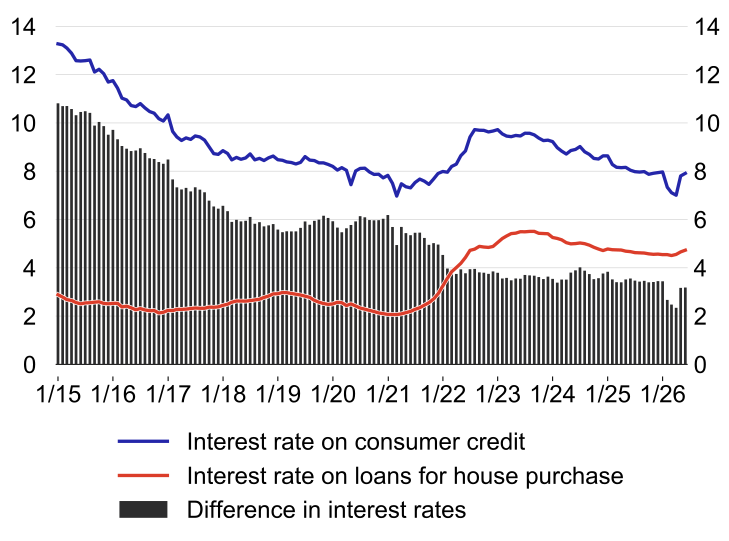
The hypothesis of a link with housing loans is supported mainly by the concentration of growth in long-term non-specific loans and by the similar patterns in new mortgage and consumer lending recently. Chart 2 shows that the two types of loans began to grow simultaneously in 2024 and continued to accelerate particularly during 2025 and early 2026. In addition to the statistics, this is confirmed by perceived demand data from the Bank Lending Survey (BLS). At the same time, the spread between interest rates on consumer credit and housing loans has narrowed to a historical low (see Chart 3).
Chart 2 – Genuinely new consumer credit has recently been growing in parallel with housing loans
genuinely new loans including increases; index: January 2015 = 100
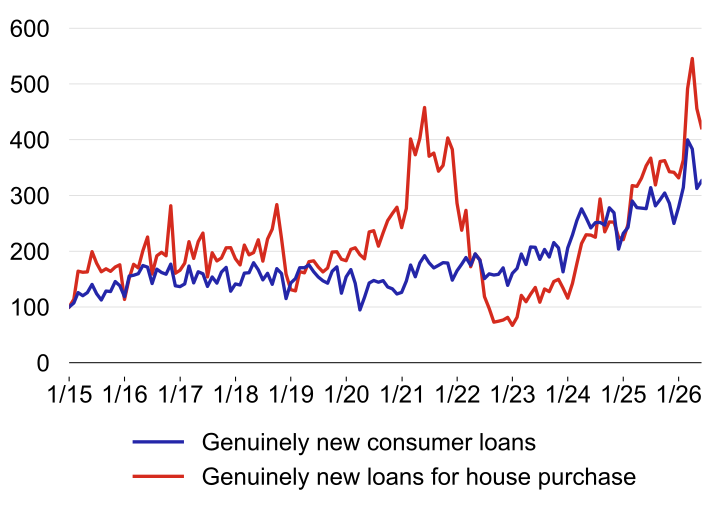
Chart 3 – The spread between interest rates on consumer credit and housing loans has narrowed
interest rates in %; spread in pp
However, growth in mortgages may not be the sole factor behind the higher demand for consumer credit. Consumer sentiment, income growth and a greater willingness to finance current expenditure through borrowing may also be playing a role. According to a correlation analysis (see Table 1), the long-term evolution of consumer credit is consistent with economic theory and the usual relationships.[2] Genuinely new consumer lending is correlated negatively with interest rates and positively with inflation. Among the monthly indicators, the strongest correlation is observed with sales of services and motor vehicles. Total retail sales are not significantly correlated, mainly owing to a weak correlation with food sales, whereas the correlation with non-food sales is positive and statistically significant. Among the quarterly variables, consumer credit is most closely linked to banks’ perceived demand as measured by the BLS, while the correlation with final consumption is driven primarily by spending on services (for example, holidays) and semi-durable goods (for example, consumer electronics).
Table 1 – Consumer credit is closely correlated with its main macroeconomic determinants; its correlation with housing loans has strengthened recently
| Correlation | |||||
|---|---|---|---|---|---|
| Lag | up to 1/24 | up to 5/26 | |||
| MONTHLY | |||||
| Interest rate on genuinely new consumer loans a) | 0 | -0.47 | *** | -0.52 | *** |
| Inflation a) | -3 | 0.75 | 0.81 | ||
| Genuinely new loans for house purchase | 1 | 0.34 | ** | 0.38 | *** |
| Sales in retail and services | |||||
| Retail sales excluding fuel | 0 | 0.39 | * | 0.39 | |
| Motor vehicles | 0 | 0.55 | *** | 0.54 | *** |
| Non-food goods | 0 | 0.41 | ** | 0.40 | ** |
| Services | 0 | 0.44 | ** | 0.43 | ** |
| QUARTERLY | |||||
| Total final household consumption | 0 | 0.58 | *** | 0.57 | *** |
| Short-term | 0 | 0.27 | 0.28 | ||
| Medium-term | 0 | 0.45 | ** | 0.44 | ** |
| Long-term | 0 | 0.40 | 0.40 | ||
| Services | 0 | 0.57 | *** | 0.55 | *** |
| Gross fixed cap. formation of households | 2 | 0.31 | * | 0.31 | * |
| Demand (BLS) b) | 0 | 0.72 | *** | 0.70 | *** |
| Standards (BLS) b) | 0 | -0.37 | * | -0.40 | ** |
Note: The table reports the correlations between y-o-y growth in genuinely new consumer credit at time t and y-o-y growth in the individual variables with the lag indicated. The exceptions are: (a) correlations between a level and an index, and (b) correlations between a level and a net percentage share. The data used for calculating the correlations start in January 2015. Statistical significance levels: *** p < 0.001, ** p < 0.01, * p < 0.05.
Comparing the results for samples ending in January 2024 and May 2026 shows that most of the correlations remain stable.[3] One of the few exceptions is new housing loans, for which the correlation coefficient is slightly higher in the sample ending in 2026 than in the sample ending in 2024. In addition, at the end of the sample, an analysis using a five-year rolling window indicates a shift in the maximum correlation from the contemporaneous relationship to a one-month lead of consumer credit. This time shift may reflect the faster response of consumer credit to common factors affecting household credit demand, due in part to the simpler and faster administrative process for arranging a loan. However, it is also consistent with the possibility that, for some households, consumer credit has recently replaced mortgage financing to some extent, particularly in the case of less costly housing-related needs.
Additional evidence can be obtained from a benchmark linear regression model[4] that explains consumer credit growth using inflation, interest rates, services sales, perceived demand and changes in lending standards from the BLS. This model explains past developments reasonably well (see Chart 4), but since 2025 it has been unable to fully explain the increase in consumer credit. For this year, the model predicts considerably lower growth than has actually been observed.
Chart 4 – Including housing loans substantially improves the model’s ability to capture the recent acceleration in consumer credit growth
growth rate in %; actual values and model estimates
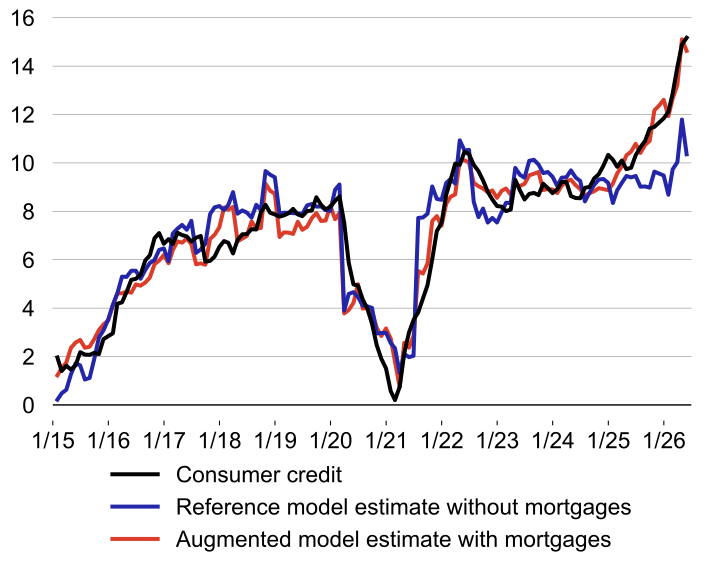
When housing loans are added to the model, the model path becomes much closer to the actual one. The contribution of this variable is particularly evident at the end of the sample, whereas in earlier periods the results of the two specifications differ only marginally. The mean absolute error of the benchmark model for January–May 2026 is 3.7 pp, compared with only 0.5 pp for the augmented specification. Including housing loans thus reduces the average estimation error by 87%. This supports the hypothesis that the current growth in consumer credit is linked not only to standard macroeconomic factors, but also to developments in the mortgage market. From a monetary policy perspective, it is therefore appropriate to analyse consumer credit and mortgage loans jointly when forecasting lending and assessing household indebtedness.
[1] Survey of consumer loans secured by residential property.
[2] To calculate the correlations, the variables are seasonally adjusted and expressed in constant prices, with the exception of interest rates, housing loans, inflation and the BLS indicators. The House Price Index is used as the deflator for households’ gross fixed capital formation. Due to potential autocorrelation, statistical significance is tested using the coefficient of the relevant lag/lead in a regression with Newey–West errors. The sample covers the period from January 2015 to May 2026 or, in the case of quarterly variables, from 2015 Q1 to 2026 Q1.
[3] For the monthly data, correlation stability was also assessed using a rolling-window approach. Correlation coefficients were repeatedly calculated for overlapping five-year (60-month) periods, with each successive window shifted forward by one month. The results suggest that the coefficients on the main variables are stable over time, while those for housing loans increase only in the final windows.
[4] The intention was to design a benchmark model that reflects the standard determinants of consumer credit growth, rather than to develop a model for forecasting future developments.