CNB RB 2/2026
We show that AI exposure in the Czech labour market is sizeable, but highly uneven. Using occupational AI exposure mapped to worker-level microdata, we find that around one quarter of tasks associated with Czech employees’ occupations can be supported, performed, or transformed by AI. Exposure is concentrated in larger urban areas, information-intensive sectors, and higher-wage jobs.
AI is rapidly diffusing across the Czech economy. In 2025, nearly half of Czech firms reported using generative AI, above the EU average of 37% and the highest share among CESEE countries (EIB, 2025). Experimental and survey evidence points to substantial productivity gains from AI tools, especially in cognitive, text-based and information-intensive tasks (Noy and Zhang, 2023; Brynjolfsson et al., 2025; Bick et al., 2026; Gambacorta et al., 2024; Marsal and Perkowski, 2025; Cui et al., 2026; Dillon et al., 2025). At the firm level, Aldasoro et al. (2026) show that AI-adopting firms in Europe are more productive than comparable non-adopting firms.
These microeconomic gains may translate into macroeconomic effects. For Czechia, Misch et al. (2025) estimate that AI could raise total factor productivity by 0.7%, thereby increasing gross domestic product (GDP). Auer and Švéda (forthcoming) estimate that Czech GDP could be around 1.8% higher given the actual level of AI capabilities . If such gains materialise, AI would represent a major structural change for the Czech economy.
This research brief provides a first glimpse into ongoing research at the Czech National Bank on AI transformation from a labour-market perspective. Using detailed employee-level data, we examine differences in AI exposure across regions and industries, as well as by wage, education, age, and gender.
Throughout this brief, we use the terms “exposed” and “exposure” in a neutral sense. Exposure refers to the extent to which tasks within occupations can be performed by AI. It does not imply that jobs will disappear, nor does it determine whether AI will complement or substitute for employees. Rather, it identifies where AI is most likely to have an impact.
Why this matters for monetary policy and financial stability
The labour-market effects of AI matter for central banking because they can influence both price pressures and the distribution of risks in the economy. If AI raises productivity, it may dampen some wage and cost pressures that would otherwise pass through to prices. However, these gains are unlikely to emerge evenly across sectors, regions or firms. Productivity growth may be concentrated among firms and industries that adopt AI quickly, while other parts of the economy adjust more slowly.
This uneven adjustment can matter for inflation dynamics. Faster productivity growth in some sectors may reduce costs, while labour-market frictions elsewhere may keep wage pressures elevated. If AI raises demand for some skills while reducing demand for others, wage dispersion may increase. For monetary policy, the relevant question is therefore not only whether AI raises aggregate productivity, but also how quickly, where and for whom these gains emerge.
The same logic applies to financial stability. If AI changes employment prospects, wage growth or regional income dynamics, it can affect household resilience and credit risk. Employees in regions or sectors with weaker adaptation may face structural challenges to find new jobs. Firms that fail to adopt productivity-enhancing technologies may lose competitiveness. Banks may therefore face a changing distribution of risks across sectors, regions and borrower groups.
We estimate the exposure by combining the US occupational AI exposure from Auer et al. (2024) with individual employee data from the Czech labour market (ISPV data).[1] The dataset contains information about 1.8 million individuals in Czechia for the year 2024 and classifies them according to a standardised occupational system (CZ-ISCO).[2] The extent to which occupations are exposed to AI has been a focus of research for some time. (Brynjolfsson et al., 2018; Tolan et al., 2021; Felten et al., 2021; Webb, 2020; Eloundou et al., 2024; Gmyrek et al., 2023, 2025; Hampole et al., 2025; Pizzinelli et al.,2023; Auer et al., 2024). The challenge is that this research is heavily U.S.-focused and thus the standardised occupations do not align with the Czech framework. We develop a methodology to bridge the differences between the U.S. occupational framework (SOC) and the Czech occupational framework (CZ-ISCO). To do so, we employ the five-step approach we show in Chart 1. In short, we use AI to generate task descriptions for Czech occupations and identify the best-matching occupation in the U.S. occupational framework. To increase the robustness, we also leverage Occupational crosswalks between the European occupational framework (ESCO) and the US occupational framework (SOC).[3] The result is that we assign for each Czech standardised occupation an AI exposure from Auer et al. (2024).[4]
Chart 1 – Mapping Czech Occupations to AI Exposure Scores
(methodological diagram; occupational-level mapping across CZ-ISCO, ESCO and SOC classifications)
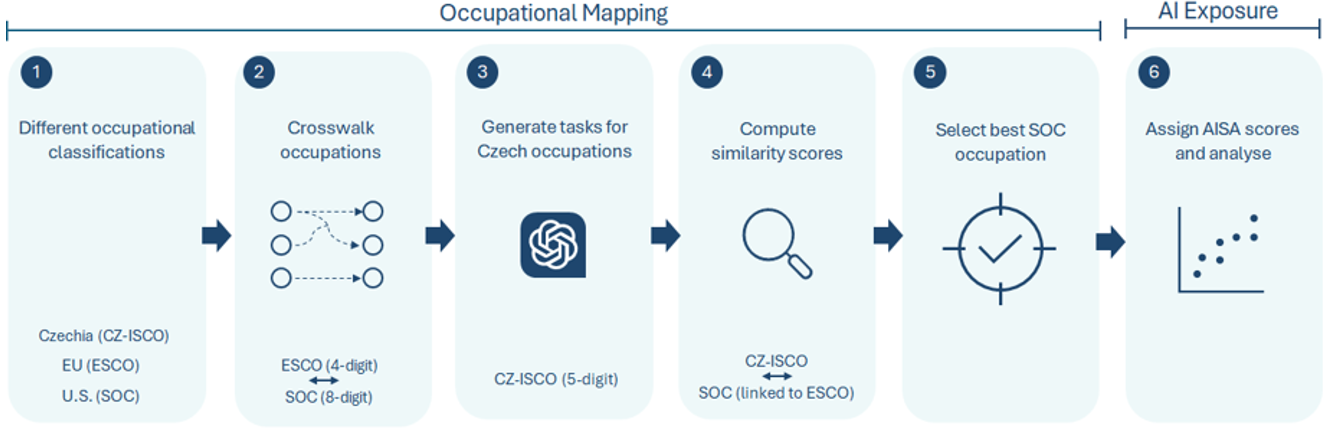
Notes: The chart summarises the procedure used to assign AI exposure scores to Czech occupations. The mapping starts from differences between the Czech occupational classification CZ-ISCO, the European ESCO classification and the US SOC classification.
Around one quarter of Czech occupational tasks is exposed to AI. In our framework, 23.2% of occupational tasks can be performed, supported, or transformed by current AI systems. This shows that a sizeable part of the Czech employees is already located in occupations where AI can change the way work is organised.
The most exposed occupations are concentrated in text-based, administrative, analytical and communication-intensive activities. These include occupations where employees prepare, process, classify, search, summarise or interpret information (e.g. CZ-ISCO position 41311: workers for editing texts). By contrast, the least exposed occupations are those where work is more physical or strongly tied to interaction with people, tools, animals or land (e.g. CZ-ISCO position 71140: Concrete placers, concrete finishers and related workers).
Chart 2 documents that this exposure is not distributed evenly across Czech employees. The distribution is concentrated at relatively low levels of AI exposure, but it has a long right tail. Many employees are only weakly exposed, while a smaller group is employed in occupations where AI can affect a much larger share of their tasks. This is important because the labour-market impact of AI is unlikely to come as a broad, uniform shock. It is more likely to appear first in selected parts of the occupational structure, especially where work is based on information processing, communication and analytical support.
Chart 2 – Distribution of AI Exposure across Czech Employees
(individual-level data; 2024)
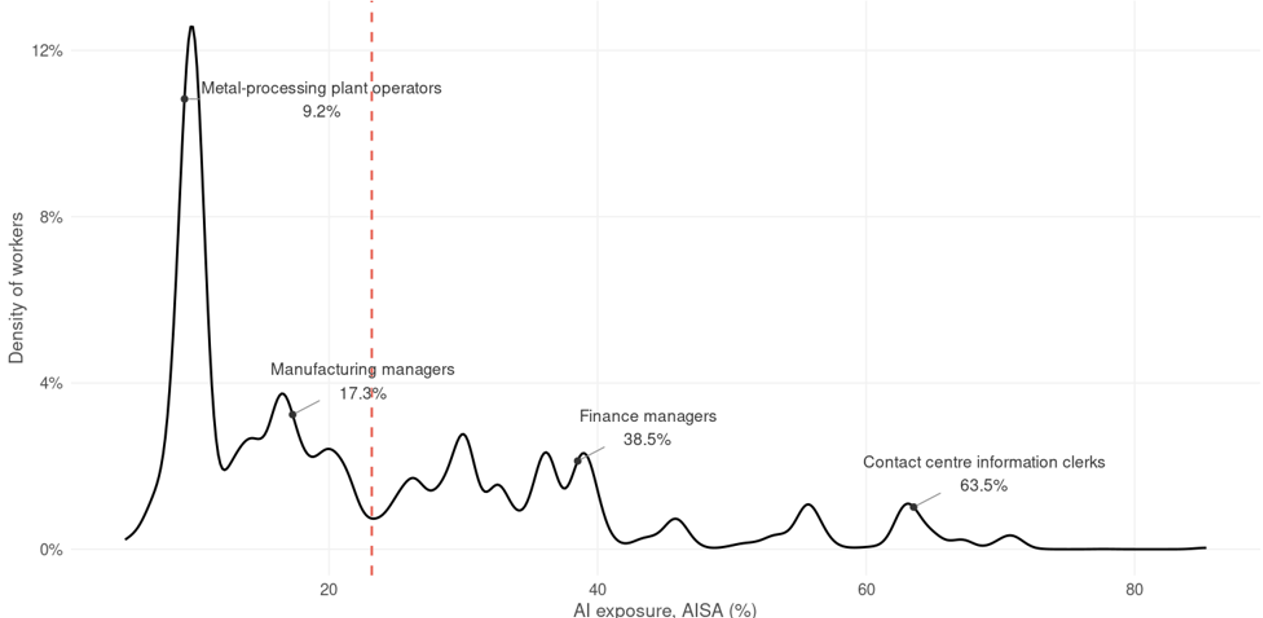
Notes: The chart shows a kernel density estimate of the employee-weighted distribution of AI exposure. The horizontal axis reports AI exposure in percent. The vertical axis reports the density of employees in the dataset. The dashed vertical line indicates the employee-weighted average. Selected CZ-ISCO occupations are shown as illustrative examples at different levels of exposure.
Exposure is not evenly distributed across the country (Chart 3). Districts with higher exposure tend to be mainly larger urban labour markets, including Prague, Brno and Hradec Králové. This reflects the concentration of office-based, professional and information-intensive occupations in larger cities. Smaller and more rural districts tend to have lower exposure as their employment structure is more tilted towards manufacturing, construction, agriculture, logistics and local services.
Chart 3 – AI Exposure across Czech Districts
(individual-level data; 2024; district-level averages)
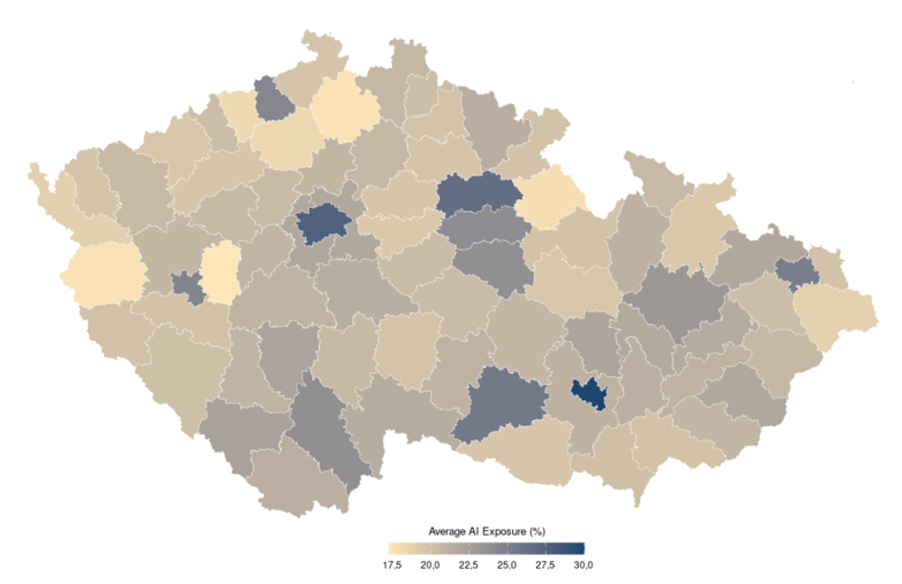
Notes: The map shows average AI exposure by Czech district. District averages are calculated as employee-weighted means across individuals in the ISPV dataset. Districts refer to the place of work. Darker colours indicate higher average AI exposure; lighter colours indicate lower average AI exposure.
The sectoral pattern shown in Chart 4 tells a similar story. AI exposure is highest in financial and insurance activities (NACE L) and in information and communication services (NACE K). These NACE sectors rely heavily on information processing, documentation, software, analytical work and communication with clients or counterparties. Exposure is lowest in mining and quarrying (NACE B) and in accommodation and food service activities (NACE I), where work is more often physical, site-specific or dependent on direct service provision.
Chart 4 – Sectoral Differences in AI Exposure
(individual-level data; 2024; economic-activity averages)
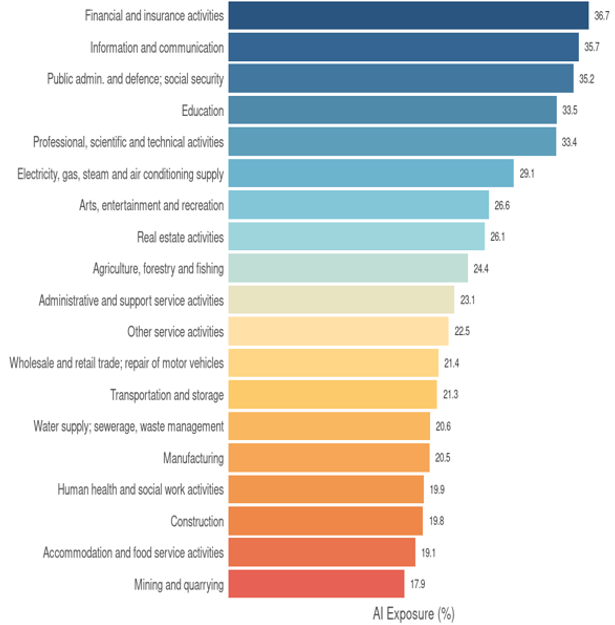
Notes: The chart shows average AI exposure across economic activities. AI exposure is assigned to employees according to their CZ-ISCO occupation. Sectoral values are calculated as employee-weighted averages across individual employees in the ISPV dataset. The horizontal axis reports average AI exposure in percent.
AI exposure is associated with higher wages. Better-paid employees are, on average, more exposed to AI. This is consistent with the international evidence showing that generative AI is particularly relevant for cognitive, computer-based and non-routine tasks (Auer et al., 2024; Eloundou et al., 2024). The pattern changes only at the very top of the wage distribution, among employees earning more than CZK 100,000 per month, where average exposure is slightly lower. This may reflect the higher share of senior managerial, strategic or highly specialised positions, where AI can support work but does not map as directly onto the occupation as a whole.
Chart 5 – AI Exposure and Monthly Wage
(individual-level data; 2024; wage-bin averages)
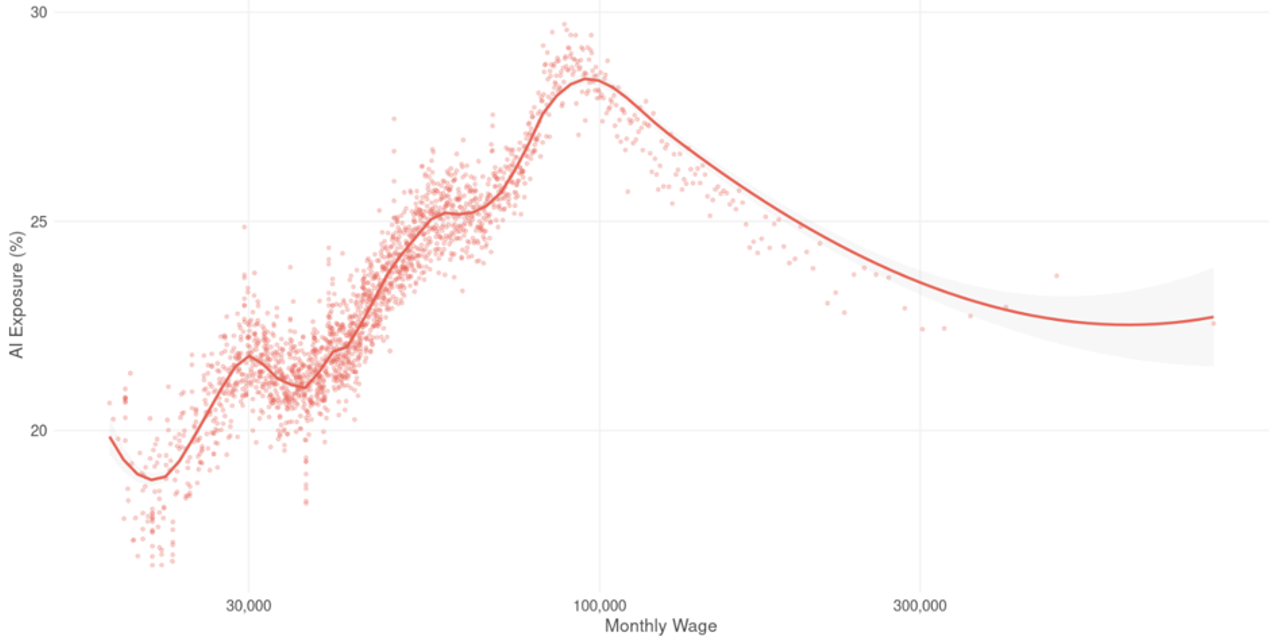
Notes: The chart shows the relationship between monthly wage and AI exposure. The vertical axis reports AI exposure in percent. The horizontal axis reports monthly wage in CZK on a logarithmic scale. Points represent wage-bin averages calculated from employee-level ISPV observations. The solid line shows a smoothed relationship between wage and AI exposure; the shaded area indicates the corresponding confidence interval.
Employees with tertiary education are more exposed than employees with lower levels of education. This does not imply that education makes employees vulnerable. Rather, it shows that AI is most relevant for occupations where formal knowledge, writing, analysis, communication and digital tools are already important. In this sense, AI exposure is closer to a measure of potential transformation than to a simple measure of labour-market risk.
Age differences are likely to matter through both occupation and adaptability. Younger and prime-age employees are more often employed in digitally intensive occupations, while older employees may be concentrated in occupations with lower direct exposure. At the same time, the impact of AI will depend not only on where employees are employed, but also on whether they can use AI tools effectively. Digital skills, training and workplace adoption will therefore be central to whether exposure turns into productivity gains or adjustment pressure.
Chart 6 – AI Exposure by Age and Education
(individual-level data; 2024; age-education group averages)
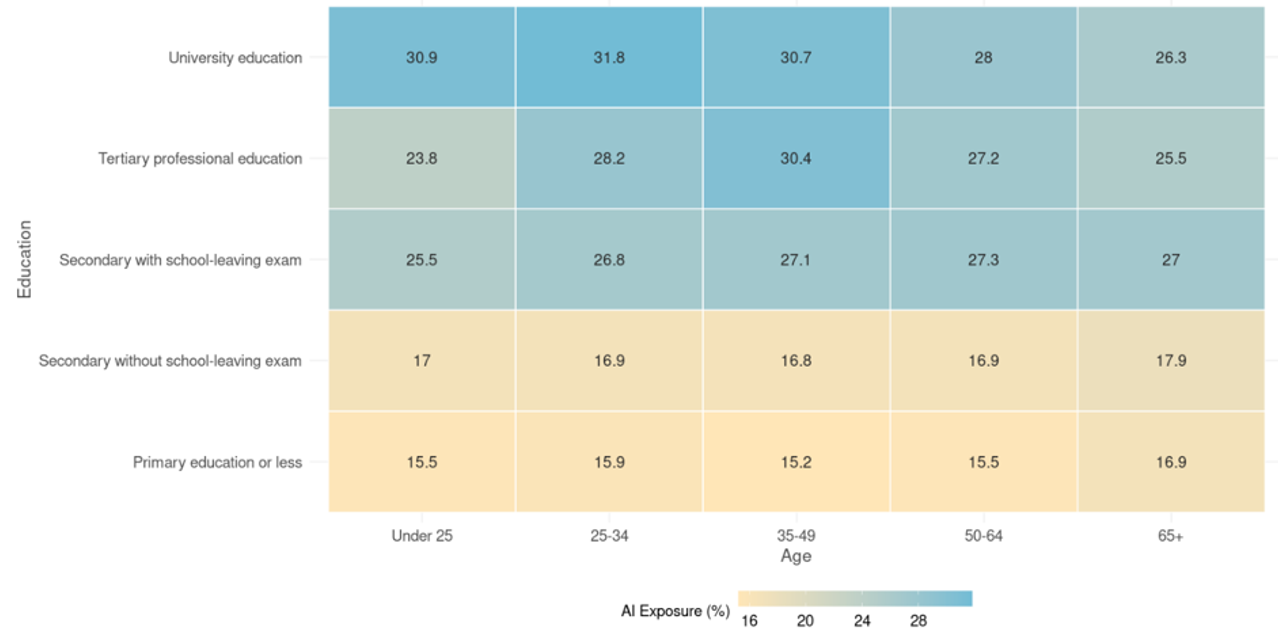
Notes: The chart shows average AI exposure by age group and highest completed education. Values are calculated as employee-weighted averages using individual observations from the ISPV dataset. The horizontal axis reports age groups and the vertical axis reports education groups. Numbers inside the cells show average AI exposure in percent. Colours represent average exposure, with darker blue shades indicating higher values and lighter yellow shades indicating lower values. Numbers in brackets represent the share of the group within the sample.
Gender differences in AI exposure are visible across the whole working life. Women are, on average, more exposed to AI than men at almost every age. This is in line with findings of Aldasoro et al. (2024) and Otis et al. (2024). Exposure rises sharply for both groups at the beginning of working life, remains elevated during prime working age and then gradually declines among older employees. The female-male gap is particularly visible between roughly ages 25 and 50. This pattern should not be interpreted as a gender effect in itself. It mainly reflects occupational sorting. Women and men are concentrated in different parts of the Czech labour market, and these occupations differ in the extent to which their tasks can be supported or transformed by AI. Higher female exposure is likely associated with stronger representation in administrative, professional, education, finance, health and service-related occupations, where communication, documentation, information processing and routine interaction with clients or institutions play an important role.
Chart 7 – AI Exposure by Age and Gender
(individual-level data; 2024; age-gender averages)
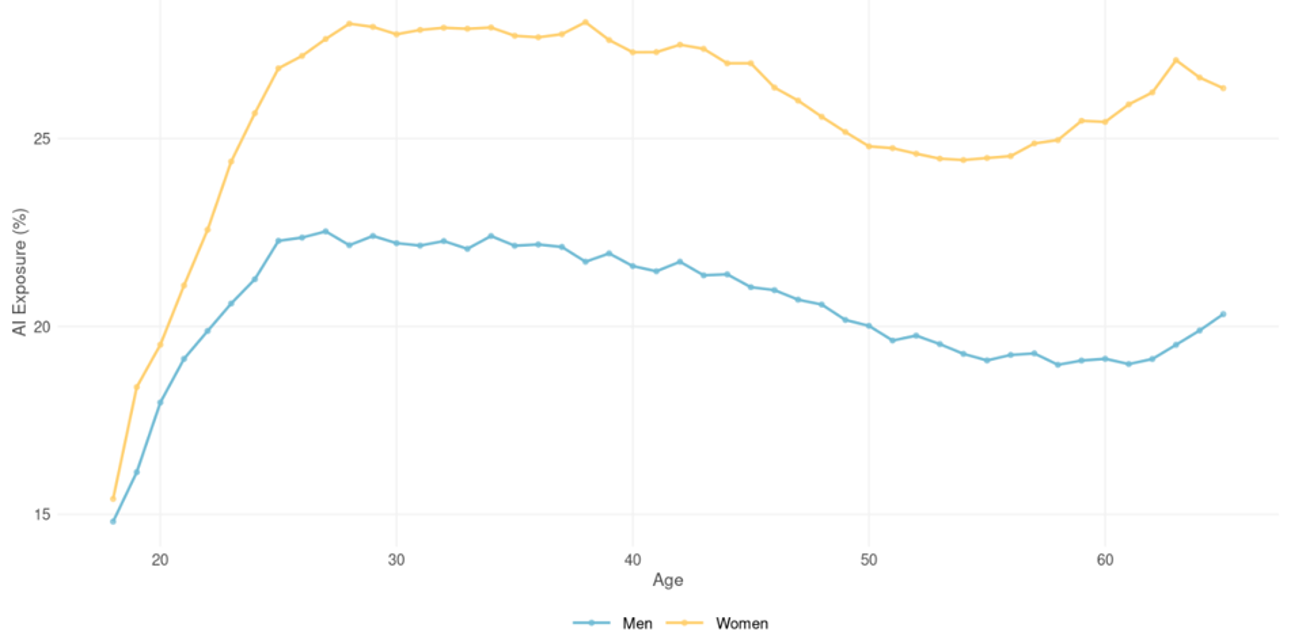
Notes: The chart reports average AI exposure across age-gender groups. Group-level values are calculated as employee-weighted averages using individual observations from the ISPV dataset. The horizontal axis shows employees’ age in years and the vertical axis shows average AI exposure in percent. The two lines distinguish men and women.
Conclusion
AI exposure in Czechia is sizeable but uneven. Around one quarter of employees are employed in occupations where AI can meaningfully affect the underlying tasks. Exposure is higher in large urban labour markets, in finance and information-intensive sectors, among higher-paid employeesand among more educated employees. It is lower in occupations and sectors where work is more physical, manual or location-specific.
These findings should not be read as a forecast of job losses. They identify where AI is likely to have an impact first. The eventual labour-market outcome will depend on adoption by firms, the ability of workers to use AI tools, the redesign of work processes and the availability of training. For some workers, AI may primarily raise productivity. For others, it may require adjustment. For policymakers, the key challenge is to ensure that the productivity benefits of AI are broad enough to support aggregate growth without creating new pockets of labour-market and financial vulnerability.
The views expressed in this article are those of the author(s) and do not necessarily represent the views of the Czech National Bank.
References
- Aldasoro, I., O. Armantier, S. Doerr, L. Gambacorta, and T. Oliviero (2024): "The gen AI gender gap." Economics Letters, 241:111814.
- Aldasoro, I., L. Gambacorta, R. Pal, D. Revoltella, C. Weiss, and M. Wolski (2026): "AI adoption, productivity and employment: evidence from European firms." EIB Working Paper No. 2026/02, European Investment Bank.
- Auer, R., D. Köpfer, and J. Švéda (2024): "The rise of generative AI: modelling exposure, substitution and inequality effects on the US labour market." BIS Working Paper No. 1207, Bank for International Settlements.
- Bick, A., A. Blandin, and D. J. Deming (2026): "The rapid adoption of generative AI." Management Science, 0(0).
- Brynjolfsson, E., T. Mitchell, and D. Rock (2018): "What can machines learn, and what does it mean for occupations and the economy?" AEA Papers and Proceedings, 108:43-47.
- EIB (2025): "EIB Investment Survey 2025: Czechia overview." European Investment Bank.
- Eloundou, T., S. Manning, P. Mishkin, and D. Rock (2024): "GPTs are GPTs: labor market impact potential of LLMs." Science, 384(6702):1306-1308.
- Felten, E., M. Raj, and R. Seamans (2021): "Occupational, industry, and geographic exposure to artificial intelligence: a novel dataset and its potential uses." Strategic Management Journal, 42(12):2195-2217.
- Gambacorta, L., H. Qiu, S. Shan, and D. M. Rees (2024): "Generative AI and labour productivity: a field experiment on coding." BIS Working Paper No. 1208, Bank for International Settlements.
- Gmyrek, P., J. Berg, and D. Bescond (2023): "Generative AI and jobs: a global analysis of potential effects on job quantity and quality." ILO Working Paper No. 96, International Labour Organization.
- Gmyrek, P., J. Berg, K. Kamiński, F. Konopczyński, A. Ładna, B. Nafradi, K. Rosłaniec, and M. Troszyński (2025): "Generative AI and jobs: a refined global index of occupational exposure." ILO Working Paper No. 140, International Labour Organization.
- Hampole, M., D. Papanikolaou, L. D. W. Schmidt, and B. Seegmiller (2025): "Artificial intelligence and the labor market." NBER Working Paper No. 33509, National Bureau of Economic Research.
- Maršál, A. and P. Perkowski (2025): "A task-based approach to generative AI: evidence from a field experiment in central banking." NBS Working Paper, National Bank of Slovakia.
- Misch, F., B. Park, C. Pizzinelli, and G. Sher (2025): "AI and productivity in Europe." IMF Working Paper No. 2025/067, International Monetary Fund.
- Otis, N. G., S. Delecourt, K. Cranney, and R. Koning (2024): "Global evidence on gender gaps and generative AI." Harvard Business School Working Paper No. 25-023, Harvard Business School.
- Pizzinelli, C., A. J. Panton, M. M. Tavares, M. Cazzaniga, and L. Li (2023): "Labor market exposure to AI: cross-country differences and distributional implications." IMF Working Paper No. 2023/216, International Monetary Fund.
- Tolan, S., A. Pesole, F. Martínez-Plumed, E. Fernández-Macías, J. Hernández-Orallo, and E. Gómez (2021): "Measuring the occupational impact of AI: tasks, cognitive abilities and AI benchmarks." Journal of Artificial Intelligence Research, 71:191-236.
- Webb, M. (2020): "The impact of artificial intelligence on the labor market." Available at SSRN 3482150.
[1]Average Earnings Information System (ISPV) is a bi-annual survey providing comparable data on earnings and hours paid of employees in the Czech Republic.
[2] The dataset covers all Czech firms with 250+ employees and a selected sample of smaller companies. Given the structure of the data, we consider it a representative sample of the Czech employees.
[3] The Czech occupational framework (CZ-ISCO) is based on the European occupational system (ESCO) and the first four digits of the individual occupational codes overlap, the CZ-ISCO differs from the ESCO in the fifth digit and thus, we would use crucial details from the Czech data if we would use the existing bridge between ESCO and SOC.
[4] We use κ= 3.2 which aligns well with the related estimates such as Eloundou et al. (2024) and Misch et al. (2025).