How accurate are AI models at nowcasting GDP?
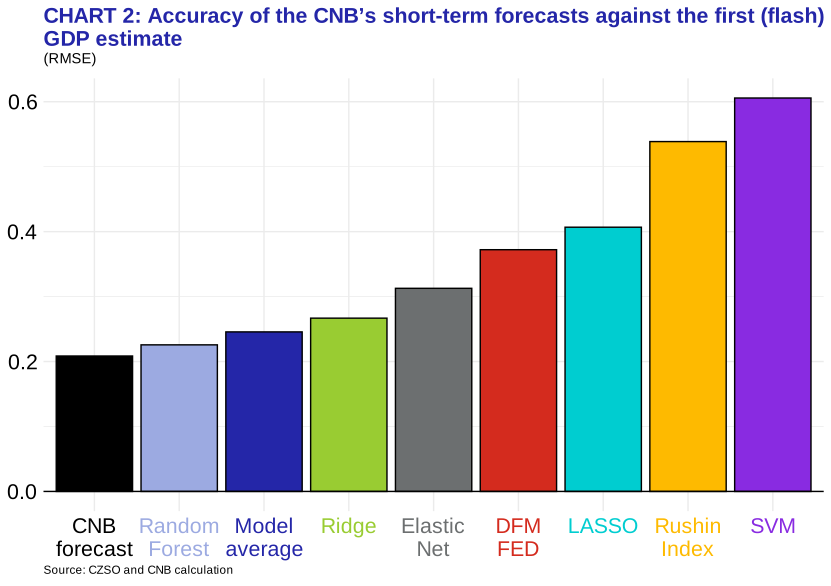
Today, 13 November 2026, CNB Governor Aleš Michl will deliver a lecture at Kyoto University, one of Japan’s most prestigious universities, on how a central bank can use artificial intelligence to read the economy in real time. As background for the lecture, we are publishing an updated version of our blog on the CNB’s progress in using AI to predict economic developments. Our main message: we are close to the point where AI nowcasts GDP better than humans and their models. Since 2023, our economists – using all the models plus their own judgement – have missed quarterly GDP growth by just 0.21 percentage points on average. Our best machine-learning model, Random Forest, with no human input, has missed by 0.22. One hundredth of a point. By results alone, we can no longer tell the human and the machine apart. For now, the human-adjusted nowcast is still the most accurate – but only just. And we are making a further improvement: the weights of the individual models will now be updated every quarter according to the models’ recent performance. AI, in the form of machine-learning models, helps. But it does not (yet?) replace people.
Introduction
The CNB is building its own technology base for artificial intelligence. Last year, we set up CNB Lab, an innovation hub that brings together our work on AI, digital assets and payments. We have bought servers and advanced NVIDIA H200 graphics cards, and we plan to add more capacity. This helps us improve internal processes, make better use of data and write model code with the help of AI in a secure environment. Our mandate is low inflation and financial stability. Better models mean better forecasts. Better forecasts mean better decisions.
In GDP nowcasting, however, we have used cutting-edge methods for some time. Nowcasting means estimating economic activity in real time, before official data come out. A central bank needs to know where the economy stands now, not several weeks later.
We started during the pandemic. Among other things, we tracked the economy using electricity consumption (Adam and Michl, 2020). We then built the Rushin index (Adam, Michálek, Michl, Slezáková, 2021), based on high-frequency indicators. It captured the pandemic-driven fall in GDP of more than 8% quarter on quarter, when traditional models fell short. Next came AI methods from the field of machine learning (AI/ML): Random Forest, SVM, Elastic Net, LASSO and Ridge Regression. Separately, in April this year, we published a working paper on forecasting inflation with quantile regression forests (Blaha, Botka, Švéda, Michl, 2026). These models not only beat linear benchmarks, they also point to the sources of risk in their own estimates. The paper built on an earlier blog post on using AI to forecast and nowcast inflation (Adam, Michl, Švéda, 2025).
This post follows two earlier ones: An introduction to the CNB’s short-term GDP forecasting tools and their accuracy (Michálek, 2023a) and How a few clever models joined forces to strengthen the CNB’s short-term forecasting arsenal (Michálek, 2023b). Three years have passed since these methods went live. It is time to take stock. We look at how the models have performed, and we introduce a further improvement in how we combine their estimates into a single forecast.
The results are very promising. The average nowcast error has fallen to an unprecedented 0.2 percentage points. Our forecasts are almost 35% more accurate than a simple statistical benchmark. But the best result does not come from a single model, or from an average of several. It comes from combining models with human judgement. AI, in the form of machine-learning models, helps. But it does not replace people.
The CNB’s suite of models
The CNB uses several models to nowcast economic activity in the current quarter. When the pandemic struck in early 2020, the methods we had been using were no longer enough. We needed an indicator built on high-frequency data that could reliably track an economy in turmoil. That is why we developed the Rushin index. It tracked the economy very accurately, above all in the most turbulent period after the pandemic began. In the second quarter of 2020, GDP fell by more than 8% quarter on quarter, an unprecedented drop, and then rebounded by more than 7%.
Around mid-2022, we added another model to the Rushin index: a dynamic factor model (DFM) developed at the Federal Reserve Bank of New York (external link). A DFM assumes that the target variable is driven by a few unobserved common factors that evolve over time. The method can also break down changes in the forecast into their individual drivers. Suppose the forecast has fallen by 0.5 percentage points since last week, and this week saw new data on industrial and construction output. The model can tell how much of the shift is due to industry, how much to construction, and how much to revisions of past data.
In spring 2023, we carried out the largest expansion of our GDP forecasting toolkit to date. Most of the new tools were AI methods based on machine learning, a field that builds systems which learn from data and improve their performance. The first group consists of LASSO (Least Absolute Shrinkage and Selection Operator), Ridge Regression and Elastic Net. These are regularised regression methods. They penalise the contributions of individual variables and so sharply reduce the weight of the less relevant ones. LASSO and Elastic Net can even drop the least relevant variables altogether. We also added SVM (Support Vector Machine) and Random Forest. SVM relies on geometric optimisation. Random Forest builds its results from a large number of decision trees, each of which splits on a different subset of the data. We also used an alternative version of the dynamic factor model, written in R (from the nowcasting package). However, its contribution shrank over time, so we decided to drop it.
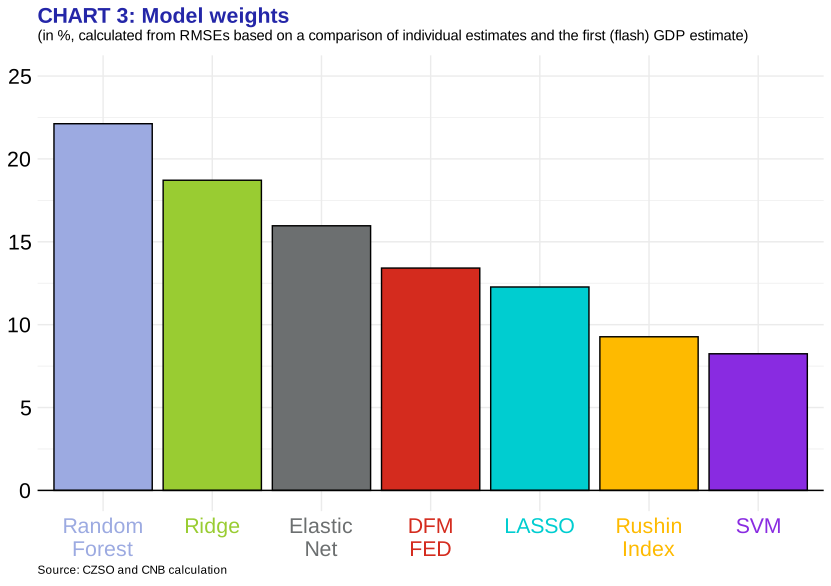
Alongside these methods, over the past three years we have also used a weighted average of them. The weights were based on each model’s historical accuracy, measured by the RMSE[1] (root mean square error) of out-of-sample forecasts. The most accurate model (with the lowest RMSE) received the highest weight; the least accurate received the lowest.
However, we do not follow the models blindly when we forecast. We also apply expert judgement. Sometimes an event may affect economic activity but does not show up in the data, or shows up only with a long lag. In such cases, the forecast has to be adjusted.
How did the models perform?
To assess each model’s accuracy, we again used RMSE. In each case, we took the model’s last prediction before the cut-off date of the CNB forecast. These are estimates made roughly two weeks after the end of the quarter in question. At that point, not all data for the quarter are yet available (the last monthly figures for industrial and construction output, or for retail and services sales, are still missing, for example). We then compared these estimates with the outcome. The outcome comes in four vintages: the preliminary (flash) GDP estimate; the first estimate, which publishes the detailed breakdown of GDP; the second estimate, which may revise the data and also publishes the sectoral accounts; and finally, the latest available estimate, after all revisions to date. We compared predictions with outcomes from the first quarter of 2023, when we started using the full range of models described above. This is also roughly when the economy began to return to normal after the wave of high inflation.
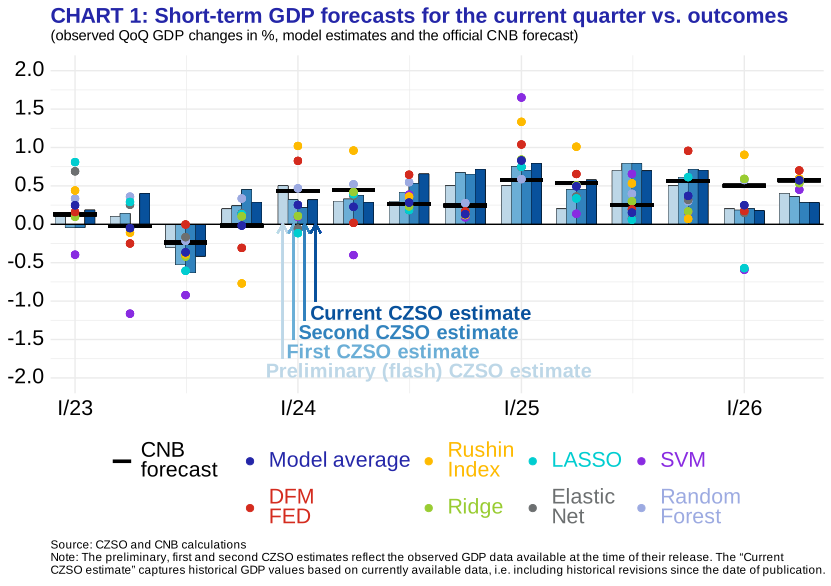
If we compare the estimates with the flash GDP estimate alone, the most accurate prediction of the past three years is, by a very narrow margin, the CNB forecast. It also came out on top in earlier periods (see the blog posts mentioned in the introduction). So, a combination of econometric and mathematical methods, human capital and a little luck still delivers the best results. Random Forest follows close behind the CNB forecast. The weighted average of the models comes third, by a hair, followed by the other methods. The RMSE values for all predictions are shown below.
We have decided to make a further improvement for future forecasts. Until now, the weights in the weighted average were fixed and based on the model accuracy after 2020. That period was highly turbulent, so some models may have been more accurate then than they are in calmer times. As we now regard the period since the start of 2023 as broadly normal, we have recalculated the weights using this period only. We will update the weights every quarter as new data arrive, so that they track changes in each model’s predictive power as closely as possible. If the Czech economy enters a more turbulent period again, however, we will also take into account how well each model tracked economic activity in past crises (for example, the dominance of the Rushin index during the pandemic).
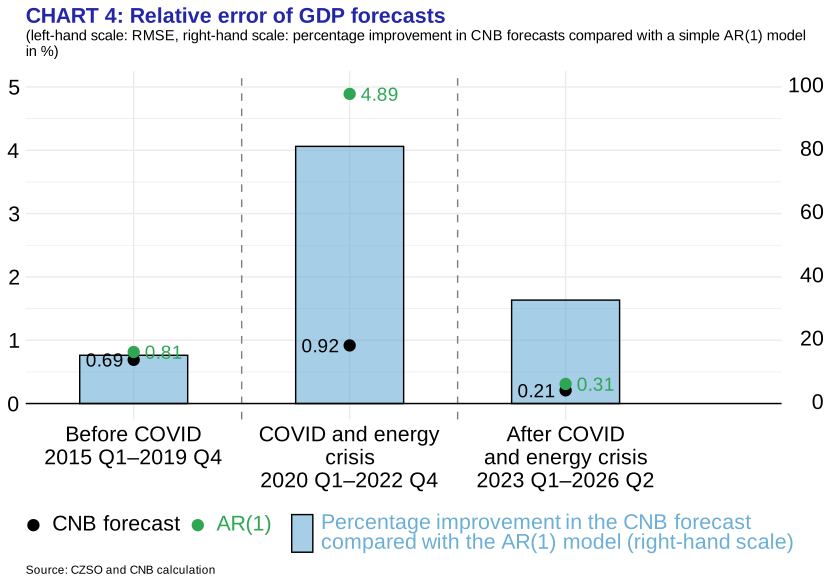
We did not only want to compare the models with each other. We also tried to estimate their real contribution to the accuracy of the CNB’s forecasts. Since none of the methods described above was used before the pandemic, we can compare CNB predictions before and after their introduction against the flash GDP estimate. We again used RMSE, but this time we split the sample into three periods: from the start of 2015 to the end of 2019; the pandemic and energy crisis (2020–2022); and the period since 2023 (Chart 4). Before the pandemic, the average error in quarter-on-quarter growth was below 0.7 percentage points. Over the next two years, it rose above 0.9 percentage points. In the current period, after the nowcasting methods were put in place, the RMSE has fallen to an unprecedented 0.2 percentage points.
Forecast accuracy depends on two things: the quality of the model, and the volatility (unpredictability) of the variable itself, which changes over time. To separate the two, we compare the CNB forecast with a simple benchmark: a first-order autoregressive model, AR(1).[2] Its errors are affected by volatility and unexpected shocks to the same degree as the CNB forecast. Measuring the CNB’s error relative to AR(1) gives us a metric from which we can judge what the new models have added.
Before the pandemic, the CNB forecast was about 15% better than AR(1). During the highly volatile period of the pandemic and the energy crisis, the benchmark’s accuracy deteriorated sharply. The CNB forecast, however, stayed relatively accurate. This was mainly thanks to the Rushin index, which (as earlier blog posts showed) was the most accurate model even in ex-post comparisons during the first quarters of the pandemic, and formed the backbone of the final forecast at that time. Towards the end of this volatile period, the DFM joined in. Taken together, over 2020–2022, the CNB forecast beat the AR(1) model by an astronomical 80%. By 2023, when we put the remaining nowcasting methods in place, the macroeconomic situation had calmed down. Yet the CNB forecast was still almost 35% better than AR(1), more than twice the relative improvement of the pre-pandemic era. Using the methods described above, together with a broader and more detailed set of existing and new data sources, has clearly improved the CNB’s short-term forecasts.
Conclusion
After six years of testing machine-learning models, we have one clear result. Before the pandemic, the CNB forecast was 15% more accurate than a simple benchmark. Today it is almost 35% better. How did we get here?
Step by step. Rushin captured the pandemic fall in GDP of more than 8% quarter on quarter at a time when traditional models fell short. The dynamic factor model added the ability to break down changes in the forecast into their drivers. Machine-learning methods sharpened the nowcast in calmer times, when high-frequency indicators lost some of their power. No model is the best in all circumstances. That is why it makes sense to keep a whole suite of them.
Yet the most accurate prediction does not come from a single model, or from an average of several. It comes from combining models with human judgement. Models do not see everything. When something happens that does not show up in the data, or shows up only with a lag, the forecast has to be adjusted. No method can do that on its own.
For future forecasts, we are moving to dynamic weights. Until now, we have calculated the weights over the whole turbulent period since the pandemic. The new weights will be updated continuously in line with how the models are performing. The result should be an even more accurate nowcast.
The best AI model is now only a hair behind the human-adjusted forecast. We may be close to the point where AI nowcasts GDP better than humans and their models. Not yet. But close.
References
Adam, T., & Michl, A. (2020). První odhad dopadů pandemie COVID-19 na ekonomiku ČR [A first estimate of the impact of the COVID-19 pandemic on the Czech economy]. čnBlog, the official blog of the Czech National Bank. https://www.cnb.cz/cs/o_cnb/cnblog/Prvni-odhad-dopadu-pandemie-COVID-19-na-ekonomiku-CR-aktualizovano-21.-4.-2020/
Adam, T., Michálek, O., Michl, A., & Slezáková, E. (2021). The Rushin index: A weekly indicator of Czech economic activity (Working Paper No. 4/2021). Czech National Bank. https://www.cnb.cz/en/economic-research/research-publications/cnb-working-paper-series/The-Rushin-Index-A-Weekly-Indicator-of-Czech-Economic-Activity/
Adam, T., Michl, A., & Švéda, J. (2025). First use of AI in inflation forecasting at the CNB. čnBlog, the official blog of the Czech National Bank. https://www.cnb.cz/en/about_cnb/cnblog/First-use-of-AI-in-inflation-forecasting-at-the-CNB/
Blaha, F., Botka, J., Švéda, J., & Michl, A. (2026). AI-Based forecasting of Czech inflation: Quantile regression forests with dynamic weights (Working Paper No. 9/2026). Czech National Bank. https://www.cnb.cz/en/economic-research/research-publications/cnb-working-paper-series/AI-Based-Forecasting-of-Czech-Inflation-Quantile-Regression-Forests-with-Dynamic-Weights-00001/
Michálek, O. (2023a). Představení a přesnost nástrojů krátkodobé prognózy českého HDP v ČNB [The CNB’s tools for short-term forecasting of Czech GDP and their accuracy]. čnBlog, the official blog of the Czech National Bank. https://www.-cnb.cz/cs/o_cnb/cnblog/Predstaveni-a-presnost-nastroju-kratkodobe-prognozy-ceskeho-HDP-vnbspCNB/
Michálek, O. (2023b). Když se pár chytrých modelů dalo dohromady, aneb ČNB posílila krátkodobý prognostický arzenál [When a few clever models joined forces: The CNB strengthens its short-term forecasting arsenal]. čnBlog, the official blog of the Czech National Bank. https://www.cnb.cz/cs/o_cnb/cnblog/Kdyz-se-par-chytrych-modelu-dalo-dohromady-aneb-CNB-posilila-kratkodoby-prognosticky-arzenal/
[1] RMSE = √ mean[(prediction − observation)²]
[2] y~t~ = c + βy~t−1~ + ε~t~. Quarter-on-quarter GDP growth in the current period depends on a constant, its value in the previous period, and a random component (noise).