CNB RB 3/2026
Europe is undergoing its largest rearmament since the Cold War, raising questions about the economic and financial consequences of higher defense spending. Drawing on a panel of 28 European countries, this brief finds that rising defense spending is associated with higher output in the short run while inflationary pressures build up only later, after about two to three years. The inflationary response is likely to be uneven: stronger where equipment is produced domestically and weaker where it is imported. Financial markets moved in parallel. Defense equity prices rose sharply in anticipation of higher spending, and European investors, including Czech households, increased their defense holdings markedly, reflecting both return expectations and geopolitical hedging.
European defense expenditure has risen markedly since 2022 and is expected to increase further. Following the Russian invasion of Ukraine, EU member states committed to sustained increases in defense budgets, with NATO targets at or above 2% of GDP and proposals for higher spending levels under discussion. Increases of this magnitude and persistence are likely to have macroeconomic and financial consequences beyond the security domain.
Defense demand appears to have grown faster than production capacity. Since 2022, military expenditure has increased more rapidly than the revenues of European arms producers, suggesting that orders have outpaced supply (Chart 1, Panel A). Under such conditions, additional demand may translate into price pressures rather than higher output alone. This brief therefore examines how rising defense spending is transmitted into inflation, output and financial markets, and why the transmission is likely to differ across countries.
Chart 1 – Production-Capacity Gap and the Geography of Rearmament
A. Military expenditure vs producer revenues
(index, 2021 = 100)
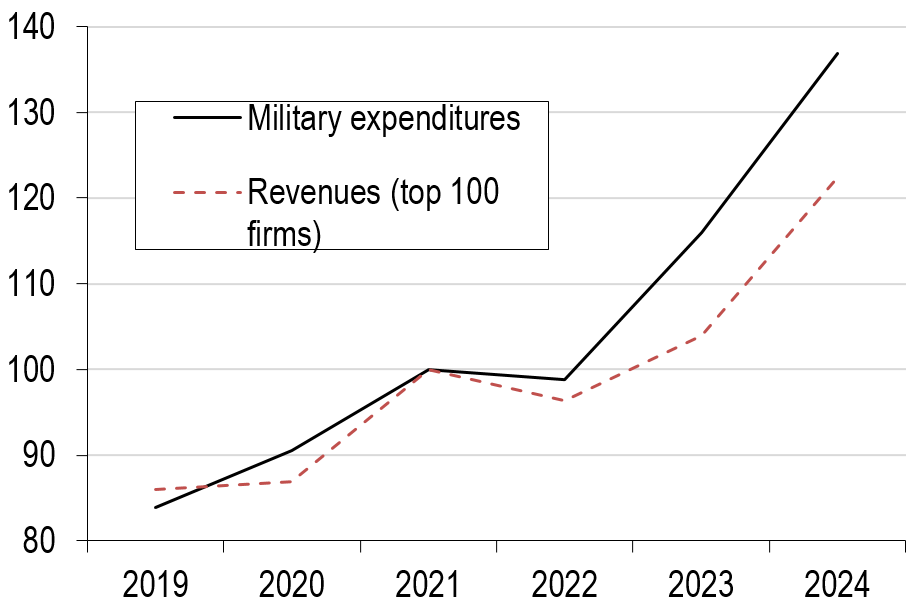
Sources: SIPRI Military Expenditure Database; SIPRI Top 100 arms-producing companies; authors’ calculations.
Note: Milex = military expenditures
B. Military expenditure by conflict proximity
(change 2021-2025, pp of GDP)
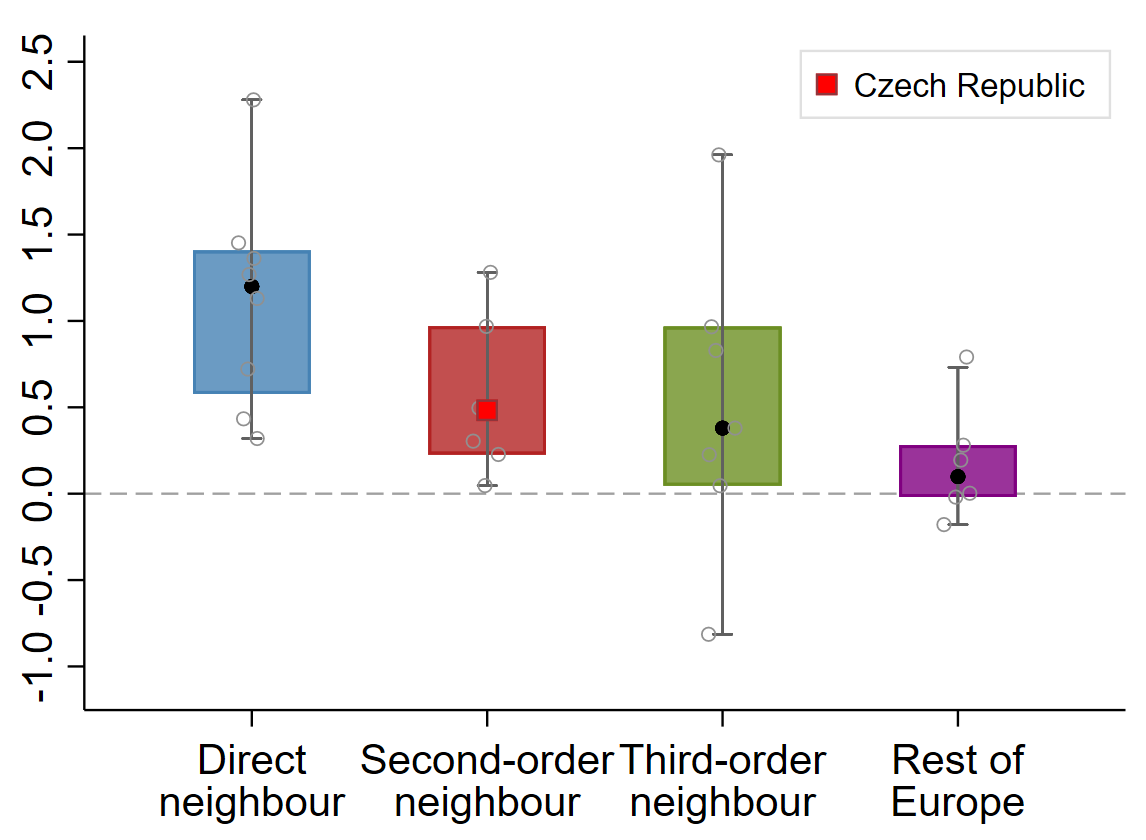
Sources: SIPRI Military Expenditure Database; authors’ calculations.
Note: Direct neighbors of the conflict (PL, RO, SK, HU, EE, LV, LT, FI).
Countries Closer to the Conflict Rearm More
The increase in defense spending since 2022 is geographically uneven. Direct neighbors of Ukraine raised military expenditure by a median of approximately 1.2 percentage points of GDP between 2021 and 2025 (Chart 1, Panel B). In countries most distant from the conflict (rest of Europe), the median change is close to zero. The Czech Republic, classified as a second-order neighbor, recorded an increase of about half a percentage point, directly at the median of its group.
The geographical pattern is consistent with historical experience. Evidence from earlier conflicts suggests that countries adjacent to a conflict tend to increase defense spending in the years following its onset, while spending in more distant countries remains broadly unchanged. This suggests that the current increases may persist in countries where the perceived security threat is highest.
The current rearmament episode represents a marked reversal of a three-decade trend. Chart 2, Panel A shows military spending in the EU falling from approximately 2.5% of GDP in the 1970s and 1980s to a trough of about 1.1% in the mid-2010s, before rising to close to 2% of GDP in 2025. The recent reversal is broad-based across countries and the Czech Republic follows the European pattern.
Chart 2 – Defense Spending in the EU: Levels and Composition
(percent of GDP)
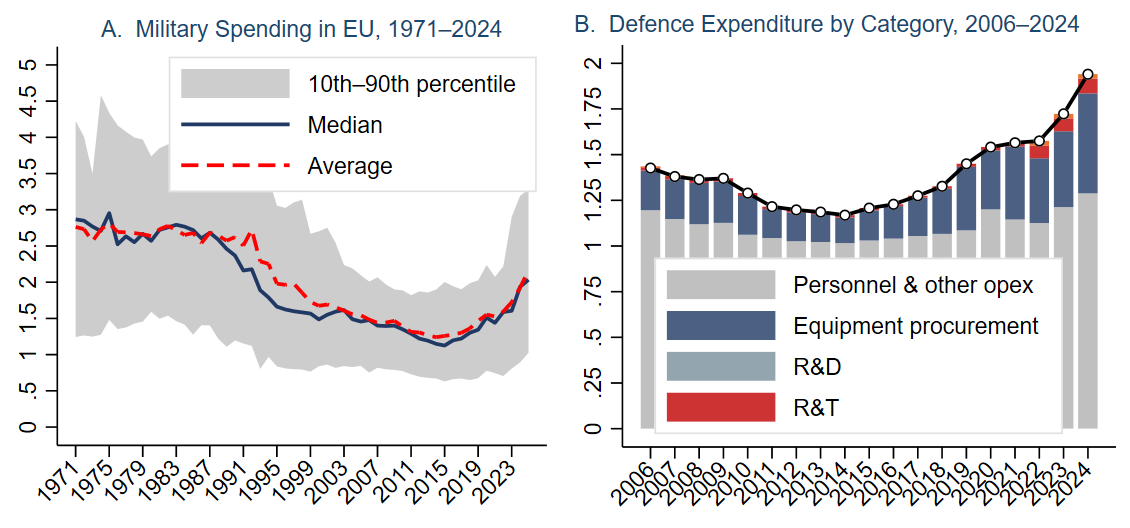
Sources: SIPRI Military Expenditure Database; European Defence Agency (EDA).
Note: Personnel and other operating expenditure (salaries, pensions, maintenance and day-to-day running costs); equipment procurement (purchases of new defense equipment); R&D (research and development, including the development of prototypes); and R&T (research and technology, i.e. earlier-stage research feeding into future capabilities).
Critically, most of the increase is driven by equipment procurement rather than personnel spending. While personnel costs still account for around two-thirds of EU defense budgets, Chart 2, Panel B shows that equipment procurement has been rising as a share of total spending since the annexation of Crimea in 2014, with a further acceleration after 2022. According to EDA (2025), equipment procurement rose by about 39% in 2024 alone, the fastest growth of any spending category. This compositional shift matters for the inflation outlook: equipment procurement is associated with the strongest price response among spending categories, as it places concentrated demand on a specialized supply chain with limited short-run elasticity (Fordham, 2003; García-Serrador et al., 2025). Research and development and technology expenditures (R&D and R&T), by contrast, remains comparatively low, at around 4% of the EU defense budget, though they have recently been catching up. Still, R&D expenditure is roughly one third of the corresponding share in the United States, limiting the potential supply-side effects of the current buildup (NSF, 2024).
Output Responds Quickly, Inflation with a Delay
Higher defense spending is associated with an immediate output response but estimated inflationary pressures emerge only after two to three years. Using local projections by Jorda (2005), we estimate the effect of a one-standard-deviation increase in defense spending relative to GDP (corresponding to about 0.12 percentage point increase). In response, GDP growth increases by approximately 0.5 percentage point in the first year and declines gradually at longer horizons, consistent with a standard demand effect (Ilzetzki et al., 2013; García-Serrador et al., 2025). The inflation response is close to zero in the first year and rises to approximately 0.5 percentage point by the third year. Estimates at longer horizons are less precise but remain positive.
The delayed inflation response is consistent with procurement and production lags. Defense orders translate into production with a lag, and price pressures tend to emerge as the supply chain approaches capacity constraints (Fordham, 2003). Using exogenous variation from procurement news, Furceri et al. (2026) obtain qualitatively similar dynamics for the EU: a short-run output expansion and a delayed, persistent rise in the price level, which suggests that the association documented here are unlikely to reflect reverse causality alone. Our own estimates should nonetheless be read as conditional correlations. The role of capacity constraints further suggests that the strength of the price response should vary with the extent to which procurement is met domestically, which the next section examines.
These estimates should be interpreted with caution. The sample is dominated by the long decline in European defense spending from the 2000s to the mid-2010s (Chart 2, Panel A), so the estimates mostly reflect spending reductions. This limitation is shared by most of the current literature. In an asymmetric specification that separates increases from cuts, however, the response to increases does not differ significantly from the baseline. Even so, the current buildup is larger and more synchronized than past episodes, so the estimates are best read as indicative of the direction and timing of the response rather than its precise magnitude.
Chart 3 – Inflation and GDP: Aggregate Local-projection Evidence
(responses to a one SD shock, in pp)
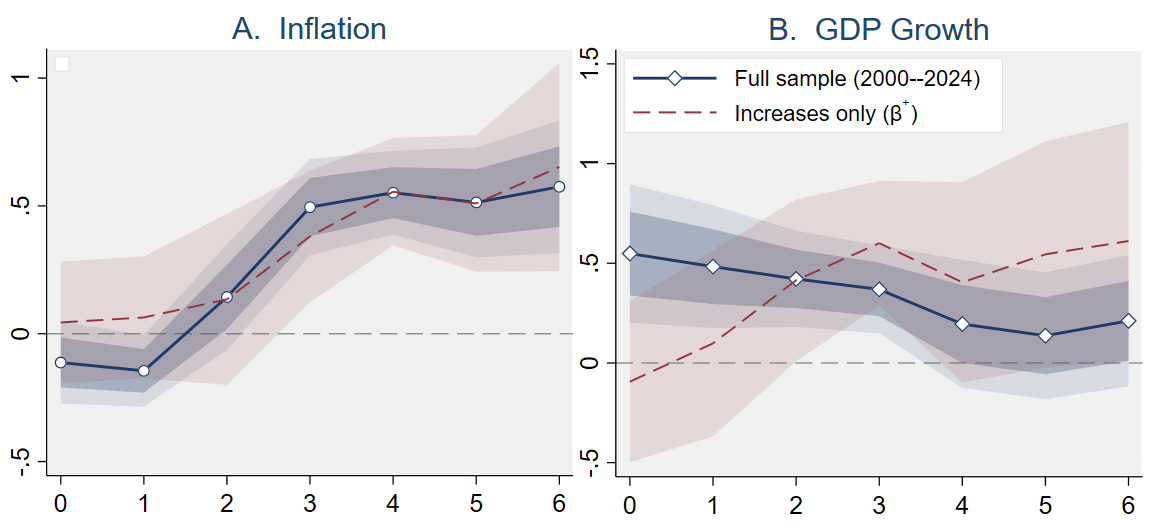
Note: Local projections on a full panel of 28 European countries. Shock: one-year lagged Milex/GDP (winsorized at the 5th–95th percentile), standardized so that one unit equals one standard deviation (app. 0.12 pp of GDP). Specification: country fixed effects, controls for GDP growth (inflation panel) or CPI inflation (GDP panel) and unemployment. Shaded bands: 68% and 90% CI.
The estimated inflation response differs markedly with reliance on arms imports. In countries with low import reliance, where defense demand is met largely by domestic producers, inflation rises early and peaks at approximately 0.7 percentage point within three years. In countries with high import reliance, the response is close to zero over the first two years and increases only at longer horizons. The intermediate group lies between these two profiles. The import-reliance grouping is only weakly correlated with proximity to the conflict, suggesting that the pattern reflects industrial structure rather than geography. The result is consistent with evidence that fiscal multipliers are larger in low-import-intensity environments, as spending leakage abroad reduces domestic factor-market pressure (Ilzetzki et al., 2013; Furceri et al., 2026).
Chart 4 – Import Reliance Shapes the Inflation Response
(responses to a one SD shock, in pp)
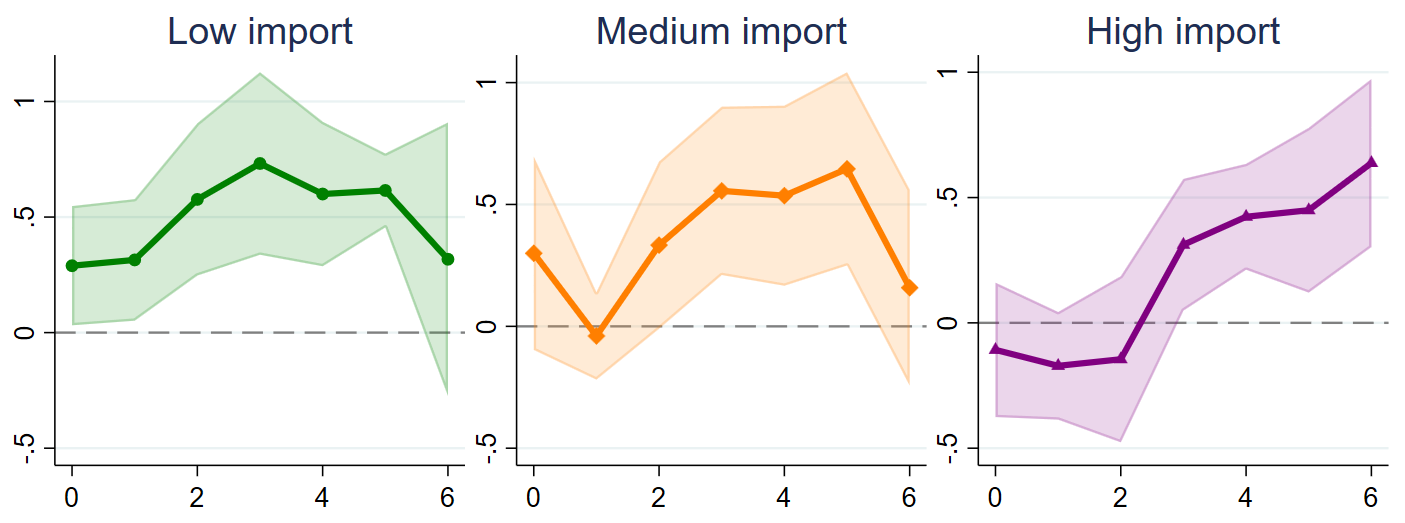
Note: Local projections on a panel of 28 European countries, estimated separately for three groups of countries. Countries are grouped by import reliance: the ratio of arms imports to total equipment procurement (SIPRI Arms Transfers and EDA, averaged over 2006–2021). We split the countries into low, medium and high tertiles. Shock: one-year lagged Milex/GDP, standardized by the within-group standard deviation so that one unit equals one standard deviation. Specification: country fixed effects, cluster-robust standard errors. Shaded bands: 90% CI. Sample: 2000–2024.
Price pressures emerge earlier, and within the policy-relevant horizon more strongly, in countries with domestic production capacity. Where procurement is directed to domestic suppliers, additional demand is likely to raise utilization in the defense supply chain and may feed into wages and prices. Structural model evidence presented in Clancy and Lozej (2026) points to the same mechanism: imported equipment generates little domestic spillover, as the associated production and knowledge remain abroad.
Beyond the scope of our estimates, the literature points to the cyclical position of the economy as a further determinant of the inflation response. Where labor and product markets are already tight, additional defense demand is more likely to raise prices than output, whereas spare capacity absorbs the shock with weaker price effects (Conigrave and Shin, 2026).
These pressures may be amplified by the coordinated nature of the current buildup. As EU member states increase procurement simultaneously, demand presses on a shared and relatively concentrated European production base, compounding capacity constraints at the domestic level. Where equipment is imported, by contrast, part of the demand stimulus accrues to foreign producers and domestic factor-market pressure is correspondingly weaker. The origin of imports also matters: leakage to non-EU suppliers represents a clear outflow of economic benefits, whereas imports from EU partners remain within integrated production networks and can still support collective security and efficiency (DNB, 2026).
The Czech Republic combines a comparatively strong domestic defense-industrial base with a significant import component (Komárek et al., 2025). In Chart 4, this would place the economy in the medium import-reliance group. The inflationary effects of higher defense spending are therefore likely to be more moderate and more gradual than in countries with predominantly domestic production, but more pronounced than in economies fully reliant on imports.
Financial Markets Repriced Ahead of the Budgets
Defense-sector equities were repriced well before the budgetary increases materialized. Chart 5, Panel A shows the market value of global defense stocks, comprising 281 firms with sizeable revenue linked to arms production and military services[1]. Their combined valuation was broadly stable until 2021, at around EUR 1.5 trillion, and more than doubled to EUR 3.5 trillion by 2026-Q1 (+134%), with European firms accounting for a growing share of the total. A portion of this repricing occurred before the bulk of the announced spending was disbursed, indicating that markets priced in future defense revenues in advance. Chart 5, Panel B shows that European investors' holdings of defense stocks roughly tripled over the same period, outpacing the rise in market valuations. The difference indicates active net purchases rather than a pure valuation effect, with investment in European firms increasing most strongly. This increase was particularly pronounced among investors from countries closer to Ukraine and had already begun after Zelensky’s election in 2019 (see Boermans et al., 2026), reflecting both return expectations and hedging against geopolitical risk (Caldara and Iacoviello, 2022; Hodula et al., 2026).
Chart 5 – Defense-Sector Equities and Investor Holdings
A. Market valuation of global defense stocks
(EUR bn)
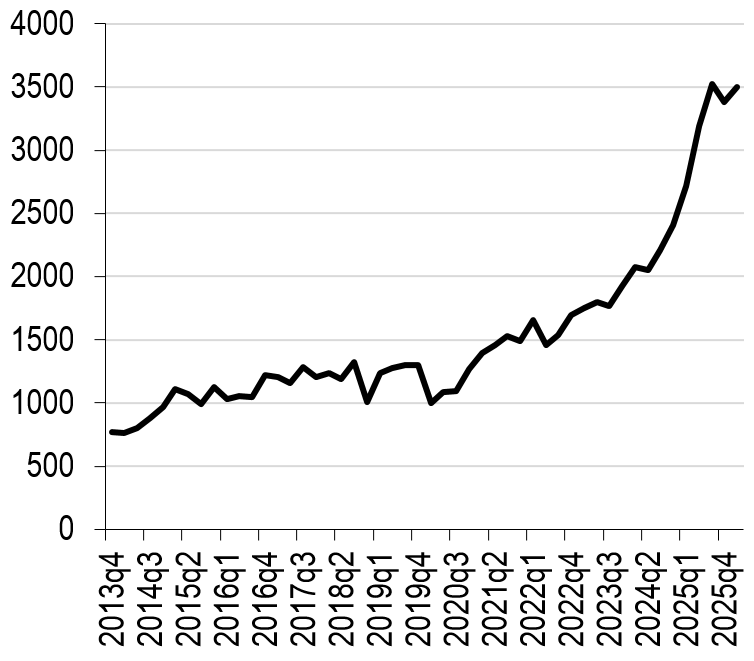
Sources: Securities Holdings Statistics (SHSS); authors’ calculations.
B. European holdings of global defense stocks, by firm region
(EUR bn)
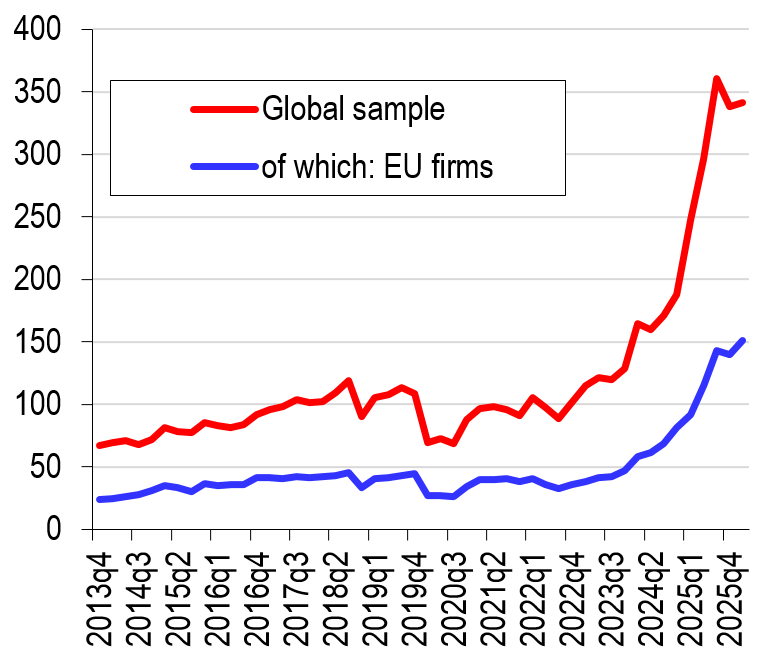
Sources: Securities Holdings Statistics (SHSS); authors’ calculations.
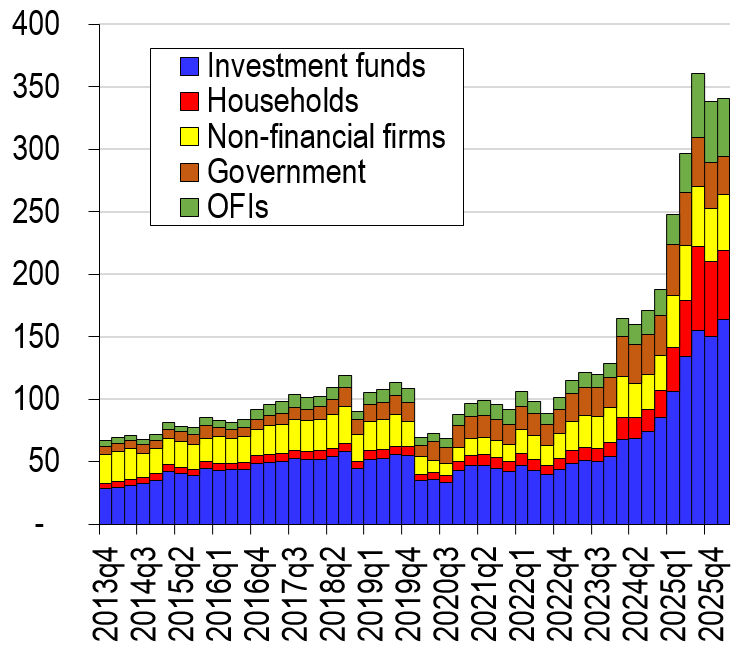
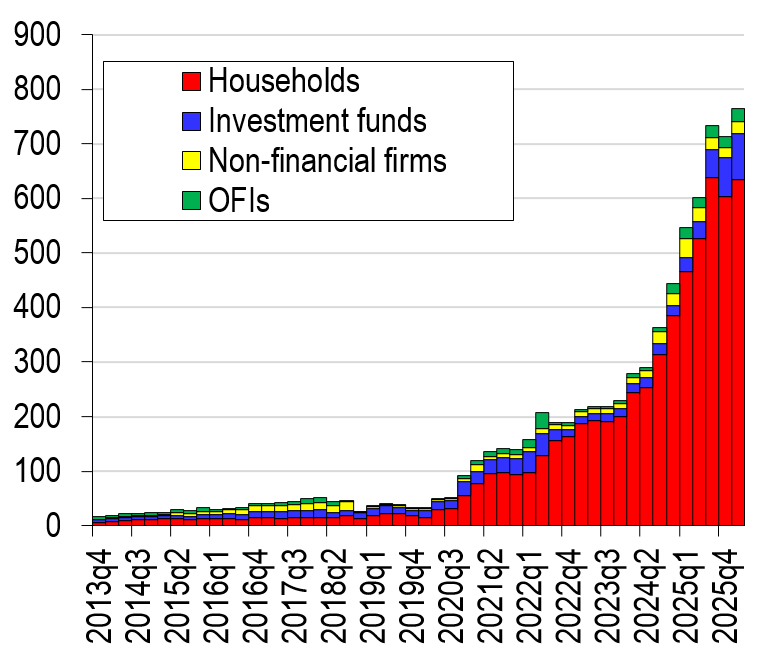
Investment funds and households account for the largest increases in defense-stock holdings. Chart 6, Panel A shows that investment funds (including mutual funds and ETFs) are the largest investors, followed by households. Households’ positions in defense stocks increased the most after the invasion, rising from EUR 8 billion at end-2021 to EUR 55 billion by 2026-Q1 (+584%). In the Czech Republic, Chart 6, Panel B documents a similar steep rise in household holdings from EUR 94 million at end-2021 to EUR 635 million by 2026-Q1 (+576%), excluding indirect exposures through foreign investment funds. The increase goes well beyond both the rise in defense-stock valuations (+134%) and the general growth of Czech households' equity portfolios (+54% over the same period), indicating deliberate net purchases. Overall, investment in defense stocks only comprise a small share of the stock portfolio, less than 1% of European households and less than 5% for Czech households.
Chart 6 – Defense Stocks: Investor Types and Czech Republic Household Holdings
A. Investor holdings by sector in the EU-27
(EUR bn)
B. Investor holdings by sector in the Czech Republic
(EUR mn)
Sources: Securities Holdings Statistics (SHSS); authors’ calculations.
Note: SHSS data are available for European Union countries only. OFIs = banks, insurance, pension funds, and other intermediaries.
Concluding Remarks
The macroeconomic effects of rising defense spending depend on how and where the money is spent. Our estimates indicate that higher defense spending is followed by a quick rise in output, with inflationary pressures building up after two to three years. The delayed inflation response is intuitive as orders take time to turn into production, and prices start to rise once producers approach the limits of their production capacity.
The inflation response differs across countries. Where defense equipment is produced domestically, prices tend to react earlier and more strongly within the first three years. Where equipment is imported, much of the demand flows to foreign producers and domestic inflation tends to stay subdued for longer. The Czech Republic, which combines a domestic defense industry with a significant import share, falls between these two cases, suggesting moderate and gradual price effects.
These findings have direct relevance for the current rearmament episode. The post-2022 increase in EU defense spending is concentrated in equipment procurement, which is the category associated with the strongest price response, and is occurring at a time when defense demand already appears to have outpaced domestic production capacity.
Financial market developments reinforce this picture. Defense-sector equities and investor holdings have responded strongly and well ahead of the fiscal expansion, suggesting that markets have already priced in a significant portion of the expected revenue stream. European households in particular have increased their exposure to the defense industry in recent years, either to reap returns from rising defense spending or to hedge geopolitical risks.
The views expressed in this article are those of the author(s) and do not necessarily represent the views of the Czech National Bank.
References
- Boermans, M., R. Galema, A. Plantinga, and B. Scholtens (2026): "The Zelensky moment: Investments in the defense industry and geopolitical risk awareness of European investors." European Journal of Political Economy, 102826.
- Caldara, D. and M. Iacoviello (2022): "Measuring geopolitical risk." American Economic Review, 112(4):1194–1225.
- Clancy, D. and M. Lozej (2026): "Spending on the frontline: The macroeconomic implications of rising defence expenditure." Research Technical Paper Vol. 2026 No. 3, Central Bank of Ireland.
- Conigrave, B. and Y. Shin (2026): "Fiscal and macroeconomic impacts of defence spending." OECD Economics Department Working Papers No. 1861, OECD Publishing, Paris.
- DNB (2026): "The economic consequences of defence spending." De Nederlandsche Bank Analysis, February 2026, Amsterdam.
- EDA (2025): "Defence data 2024–2025." European Defence Agency, Brussels.
- Fordham, B. O. (2003): "The political and economic sources of inflation in the American military budget." Journal of Conflict Resolution, 47(5):574–593.
- Furceri, D., P. Juarros, S. Mishra, A. D. M. Nguyen, A. S. Pessoa, and A. Sollaci (2026): "Macroeconomic impacts of EU defense spending." IMF Working Paper No. 26/53, International Monetary Fund.
- García-Serrador, A., D. Sarasa-Flores, and C. Ulloa (2025): "Buy guns or buy roses? EU defence spending fiscal multipliers." BBVA Research Working Paper 25-06.
- Hodula, M., J. Janků, and S. Malovaná (2026): "Flight from the front line: Geopolitical risk, distance, and capital flow dynamics." Research Brief 1/2026, Czech National Bank.
- Ilzetzki, E., E. G. Mendoza, and C. A. Végh (2013): "How big (small?) are fiscal multipliers?" Journal of Monetary Economics, 60(2):239–254.
- Jorda, O. (2005): "Estimation and inference of impulse responses by local projections." American Economic Review, 95(1):161–182.
- Komárek, L., M. Zeman, and P. Polák (2025): "Economic impacts of defence spending in Europe: Between growth and fiscal burden." cnBlog, Czech National Bank, 3 November 2025 (published in Global Economic Outlook – October 2025).
- NSF (2024): "Federal R&D funding, by budget function: Fiscal years 2022–24." NSF 24-310, National Science Foundation, Alexandria, VA.
[1] Defense firms are taken from SIPRI and constituent lists of mutual funds that focus exclusively on defense firms.